

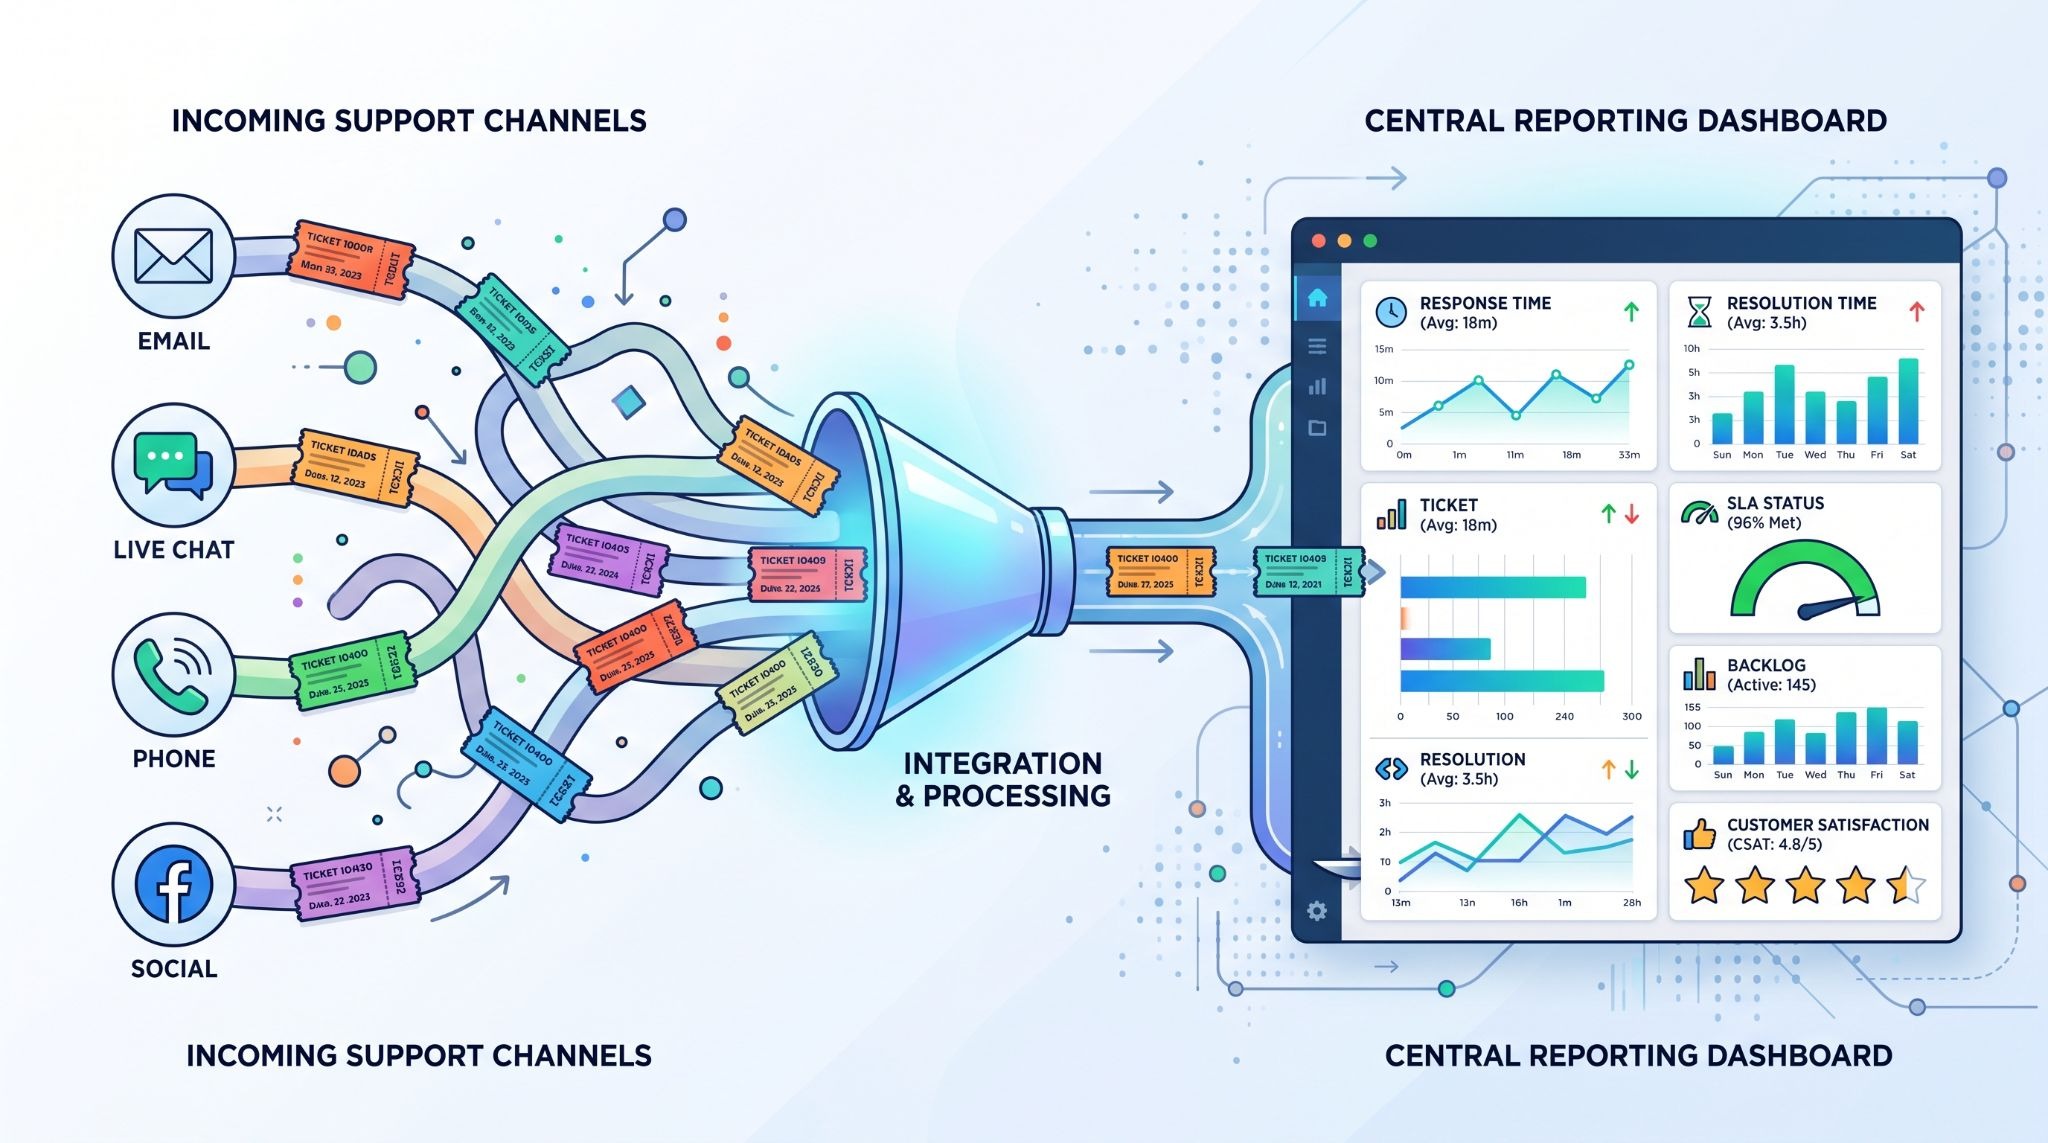
Reporting metrics ticketing integration helps MSSP Security turn ticket data into useful reports for MTTR, FRT, FCR, SLA performance, backlog, and CSAT. The point isn’t to collect every number available. It’s to track data that helps the team spot delays, review service quality, and see where tickets get stuck.
With ticket events connected to analytics and dashboards, teams can follow trends without checking each ticket by hand. That makes reporting easier to review and share. Keep the metrics focused, or the dashboard can get noisy fast. That’s where many teams slip. Keep reading to see which metrics matter and how MSSP Security can use them.
Quick Reads: Reporting Metrics Wins
A quick summary of the key metrics and practices that make ticketing integration reporting useful.
- Track key KPIs: FRT, MTTR, FCR, SLA, backlog, escalation rate, and CSAT.
- Keep data reliable: Use APIs, webhooks, and consistent timestamps.
- Make it actionable: Use dashboards to spot delays, trends, and risks.
What Is Reporting Metrics Ticketing Integration?
Reporting metrics ticketing integration connects a ticketing or ITSM system to a reporting layer where ticket activity can be measured over time.
A ticket contains much more than the issue itself. It can include the creation time, priority, category, assigned analyst, status history, response time, escalation path, resolution time, and customer feedback. Once those details reach an analytics system, they can support ITSM reporting, ticketing integration analytics, and operational dashboards.
That sounds straightforward. In practice, it often is not.
We regularly see reporting projects where the dashboard looks polished but the underlying ticket fields are inconsistent. One team may use “pending customer” while another uses “waiting for user.” If those states are treated differently, the final numbers can be misleading.
“Measures should be accurate and timely.” – NIST
How Does Ticket Data Become Business Insight?
Ticket data becomes useful when each event has a clear meaning and a reliable timestamp.
The basic path is simple. A ticket is created. Someone responds. The ticket moves through different statuses. It is resolved and closed. Those events can then be used to calculate response times, resolution times, SLA performance, workload, and recurring incidents.
Consider a service desk with 500 open tickets. That number alone says very little. The picture changes when the report shows that 60 tickets are more than 30 days old, 15 have breached an SLA, and most of the older cases belong to one service.
That is the kind of detail an operations team can work with.
We also look at the source of the ticket. Email, chat, phone, portal submissions, and automated alerts can behave very differently. Ticket source breakdown and channel performance analytics help explain where demand is really coming from.
When teams work across connected systems, bidirectional ticket synchronization can also keep relevant ticket updates aligned between platforms.
Why Is Ticketing Integration Important for Reporting?
Ticketing integration matters because it gives teams a more current view of service performance, SLA compliance, and workload. Integrating ticketing systems can reduce the need to move data between separate tools before reporting begins.
Without integration, someone often exports a CSV, cleans it, checks formulas, and builds another spreadsheet. By the time the report reaches management, the queue has already changed.
A connected reporting pipeline can update the numbers as new events arrive. It also creates a better record for historical trend analysis.
For security teams, the same principle applies to operational evidence. NIST SP 800 55 Volume 1, published in December 2024, covers measure selection, data quality, reporting, and uncertainty.
The goal is not to report everything. It is to report the things that help someone make a better operational decision.
Which Ticketing Metrics Matter Most?
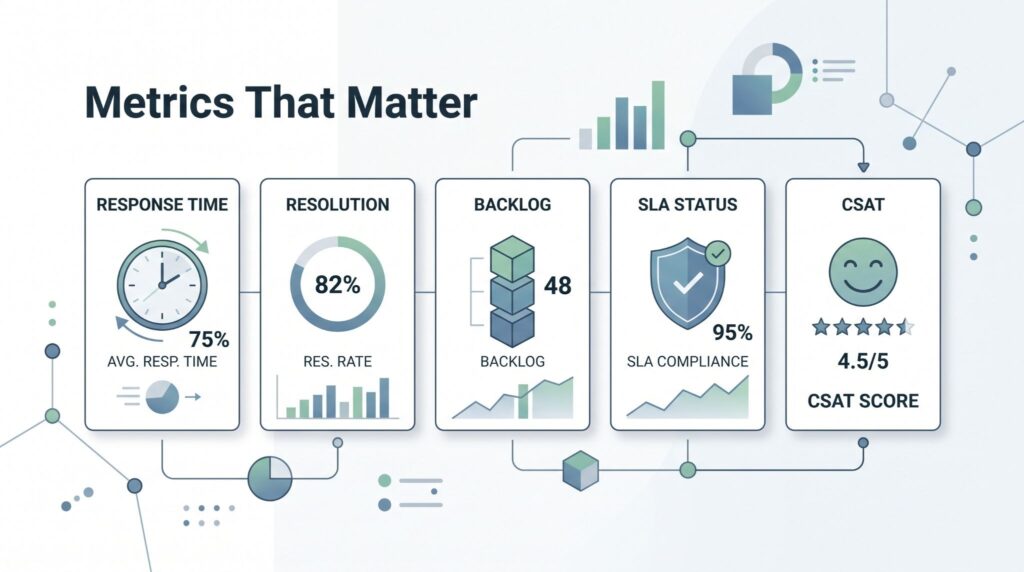
The most useful metrics usually cover five areas: response, resolution, queue health, service quality, and escalation.
| Category | Metric | What It Measures |
| Response | First Response Time | Time until the first response |
| Resolution | Mean Time to Resolution | Average time to resolve |
| Resolution | First Contact Resolution | Tickets solved without further handling |
| Volume | Ticket Inflow and Outflow | Tickets received compared with tickets closed |
| Queue | Backlog Growth | Change in unresolved work |
| Quality | Reopen Rate | Tickets reopened after closure |
| SLA | SLA Breach Rate | Tickets that exceed the agreed target |
| Customer | CSAT | Customer satisfaction after service |
| Escalation | Escalation Rate | Tickets moved to a higher support tier |
These numbers answer different questions, so they should not be treated as interchangeable.
“Dashboards and metrics: monitor volume, resolution time, escalation rates, recurring issues.” – Section508
A manager might care about MTTR. A team lead may care more about backlog age and first response time. A security operations manager may also need security incident reporting, remediation age, access review completion, and audit evidence reporting.
The right metric depends on the decision being made.
How Does SLA Compliance Tracking Work?
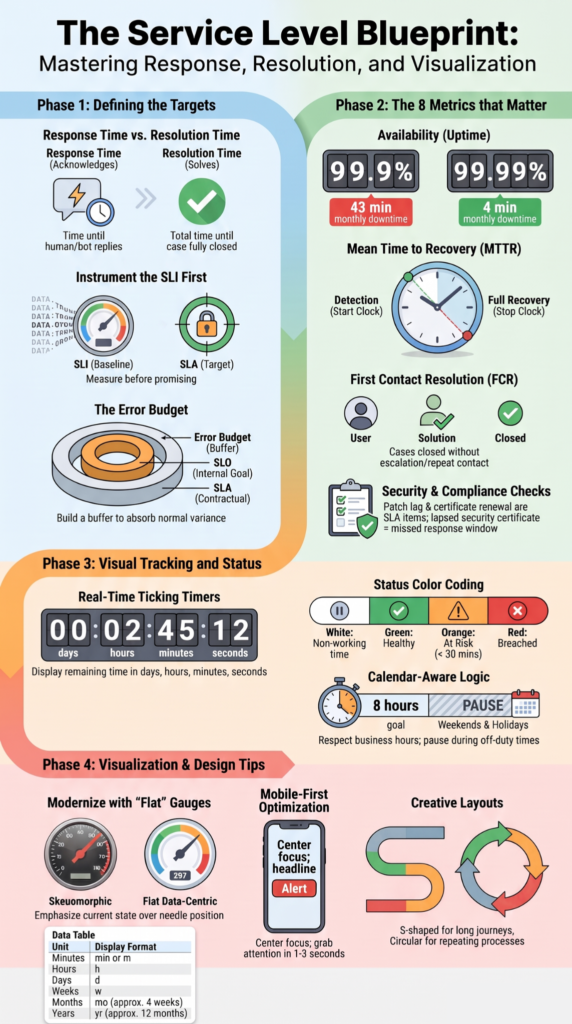
SLA compliance tracking compares ticket activity against agreed response and resolution targets.
The reporting system needs to know when the SLA clock starts, when it stops, which statuses pause the clock, and which business calendar applies.
For example, a 4 hour resolution SLA means something different when the service operates 24 hours a day compared with a service that operates only during business hours.
What Makes SLA Reporting Inaccurate?
Several small data issues can change the result.
Timezone differences can shift timestamps. Missing status changes can make a ticket appear active when it was actually waiting. Different teams may also use different definitions for “resolved” or “first response.”
That is why SLA target configuration should be treated as part of the reporting model, not simply as a number displayed on a dashboard.
Why Do Business Hours Matter for SLA Tracking?
Business hours determine when time should count toward an SLA.
A ticket created at 6 PM on Friday could have a very different result under a 24 hour service calendar than under a Monday through Friday schedule.
We normally recommend storing the timezone, service calendar, holiday rules, pause conditions, and SLA target alongside the ticket event data. It makes later audits much easier.
And it prevents a surprisingly common problem: two reports showing different SLA results for the same tickets.
How Does Ticket Volume Analytics Show Team Workload?
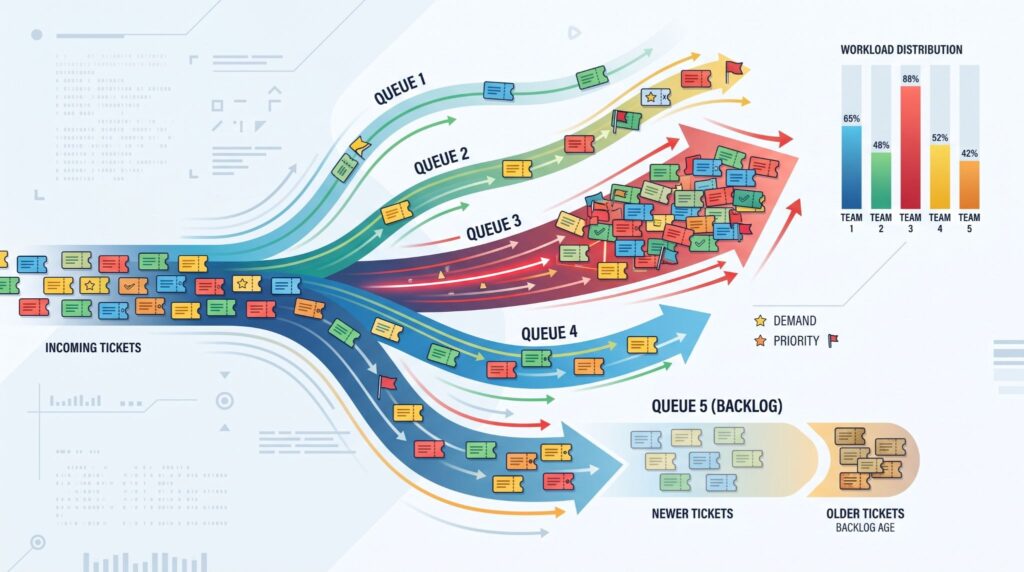
Ticket volume analytics looks at inflow, outflow, backlog, age, priority, and ticket source together.
A team that receives 1,000 tickets and closes 1,050 is not automatically healthy. The remaining backlog might contain older critical cases. On the other hand, a growing queue may be reasonable during a short term incident.
Context changes the story.
When Does Backlog Become an Operational Warning?
Backlog becomes more useful when teams track its age instead of only its size.
A report can separate tickets that are less than seven days old from those that have been open for 30, 60, or 90 days. It can then connect those cases with priority, SLA status, owner, and last activity. Looking at incident severity alongside ticket age also helps teams see whether critical cases are remaining open longer than lower priority work.
That gives managers a better view of ticket aging, backlog age analysis, breach counts, and demand trends.
How Does Workload Distribution Support Capacity Planning?
Source: Layla at ProcessDriven
Workload distribution shows who is carrying the work and what kind of work they are handling.
Two analysts might each close 40 tickets, but their workloads may be very different. One may handle routine access requests. The other may spend hours investigating security incidents.
For that reason, agent productivity metrics should be read alongside complexity, priority, escalation, and resolution time.
That is where capacity planning becomes more practical. The numbers begin to show not just how much work exists, but what kind of work is consuming the team’s time.
FAQs
How Can Ticketing Integration Analytics Reveal Hidden Support Bottlenecks?
Ticketing integration analytics can connect ticket volume, workload distribution, and resolution data across support channels. This helps teams identify where requests slow down or accumulate. Comparing first response time, average resolution time, escalation rate, and ticket backlog aging can show whether delays come from high demand, inefficient routing, or limited staff capacity.
Which Metrics Help Explain Why SLA Targets Are Being Missed?
SLA compliance tracking becomes more useful when teams examine several metrics together. First response time, mean time to resolution, resolution SLA attainment, and breach counts can show where delays occur. Custom SLA reporting can also separate departmental SLA metrics, helping teams determine whether missed targets relate to workload, ticket priority, routing problems, or insufficient service desk capacity.
How Can Teams Tell If Ticket Volume Is Affecting Resolution Times?
Ticket volume analytics can show whether increased demand is contributing to slower resolution. Compare service request volume with average resolution time, ticket closure rate, and workload distribution over the same period. Historical trend analysis can reveal recurring patterns, such as peak periods when higher demand causes backlog growth, more escalations, or greater reliance on specialist teams.
How Can Teams Measure Whether Self-Service Is Reducing Ticket Demand?
Self-service portal analytics can show whether users resolve common issues without submitting tickets. Teams can compare ticket deflection rate, knowledge base effectiveness, and knowledge reuse rate with overall ticket volume. A reduction in repetitive requests, combined with stable service quality indicators, provides clearer evidence that self-service is reducing avoidable demand.
How Should Teams Compare Resolution Performance Across Priority Levels?
MTTR by priority provides more useful detail than one overall resolution figure. Teams can compare mean time to resolution, major incident metrics, critical incident reporting, and tier resolution metrics across priority levels. This shows whether urgent issues receive timely attention and whether lower-priority tickets remain open longer than expected, creating unnecessary backlog and workload.
Build Ticketing Analytics Around What Matters
When ticketing data is inconsistent or SLA tracking isn’t reliable, dashboards can make simple operational problems harder to see. You need reporting that shows what changed and where attention is needed. Keep it practical.
MSSP Security can help turn that reporting into a workable framework without adding unnecessary complexity. Its experience supporting MSSPs can help you improve integration, reduce tool sprawl, and build clearer operational visibility, giving your team a more practical way to use ticketing data for better decisions.
References
- https://www.nist.gov/baldrige/thinking-about-performance-measurement
- https://www.section508.gov/manage/section-508-help-desk/