

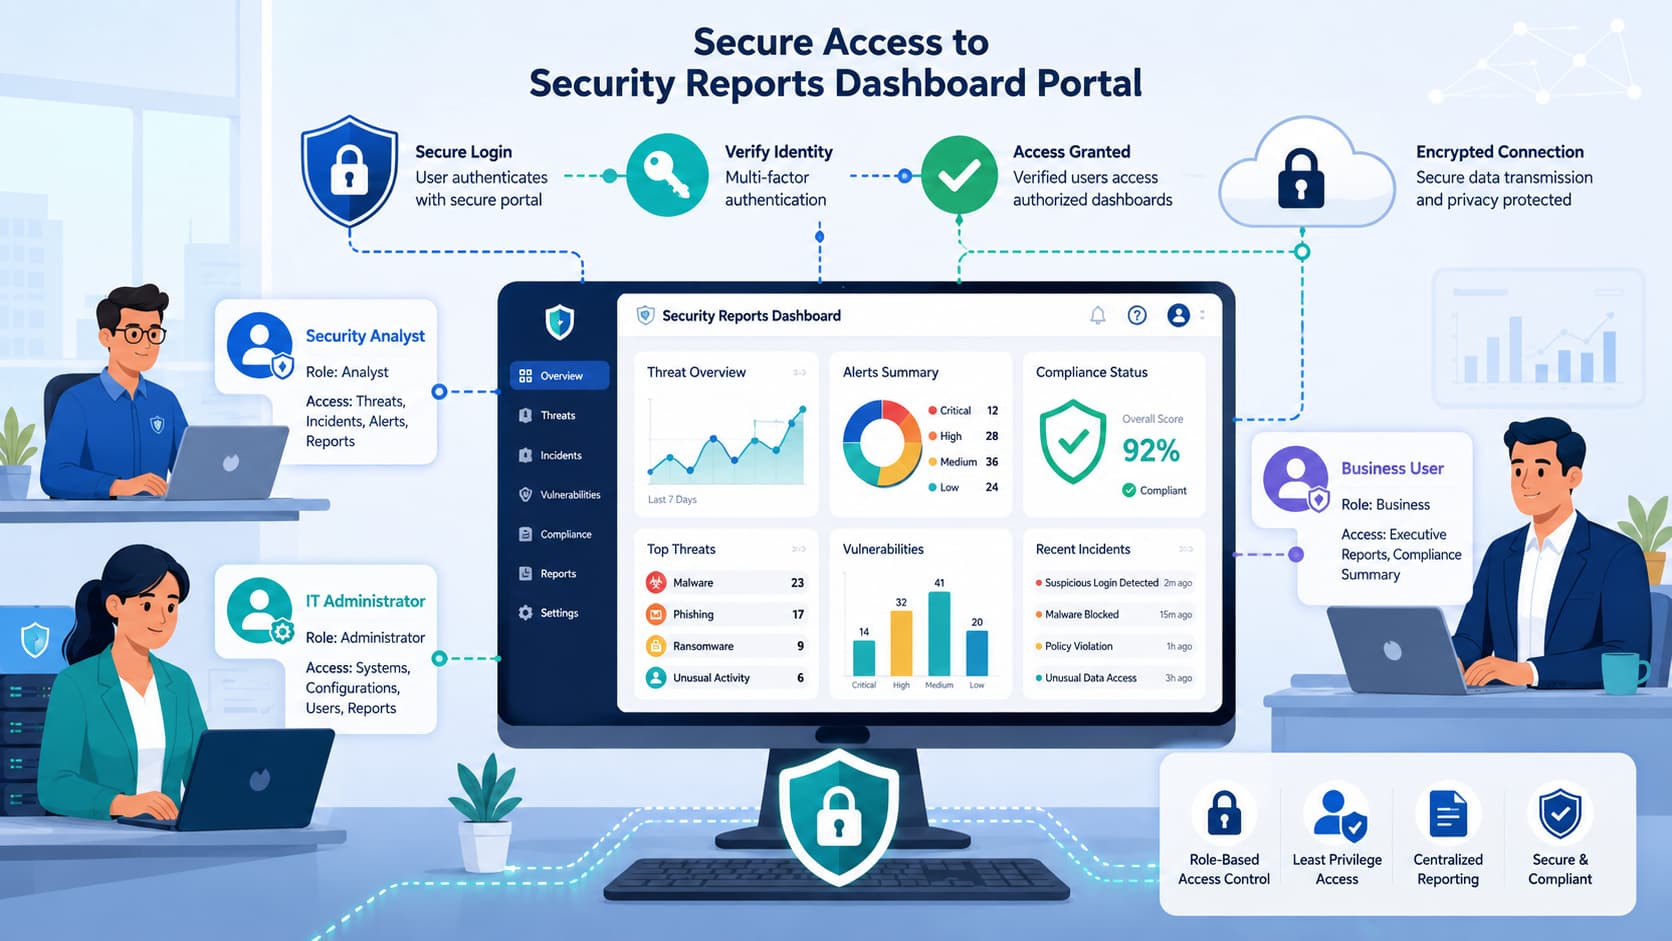
When a dashboard loads completely blank, it is rarely a data collection failure; it is almost always an unmapped Role-Based Access Control (RBAC) token.
Diagnose portal access by checking account permissions first, then verifying the correct report section before investigating other causes. If the issue persists, review licensing, authentication, and browser settings, as these are easy to overlook.
MSSP Security recommends confirming access rights before escalating to engineering, saving time and reducing unnecessary troubleshooting. Keep reading to learn where to find security reports, why access fails, and the practical steps to restore dashboard visibility.
Quick Access Checklist for Security Report Dashboards
Accessing security reports is easier when you follow a consistent process. Start by confirming access, then navigate to the correct reporting area before reviewing or exporting reports.
- Sign In and Verify Access Log in to your organization’s security portal and confirm your dashboard access permissions before troubleshooting.
- Open and Review Reports Navigate to the Reporting or Security Center section, select the required security reporting dashboard, and apply filters such as date, workload, or severity.
- Export Reports When Needed Export reports for audits, compliance requirements, or executive reviews after confirming the displayed data is accurate and complete.
Why Do Security Report Dashboards Matter?
Security reporting dashboards bring operational and executive reporting together in one place, making it easier to monitor threats, compliance, and infrastructure without switching between multiple tools.
Many organizations already collect plenty of security data. The real challenge is turning that data into timely, actionable insights.
During a recent security stack audit for a mid-market MSSP managing more than 50 client tenants, analysts were spending about 12 hours each week manually combining CSV exports from multiple endpoint tools into customer reports.
Consolidating those workflows into a centralized security analytics dashboard removed the reporting bottleneck and gave analysts more time for proactive threat hunting.
As environments expand, centralized dashboards become even more valuable by combining incidents, vulnerabilities, compliance status, and operational metrics into a single view.
This reduces manual reporting, improves visibility, and helps security teams focus on investigations instead of data collection. Effective dashboards also prioritize measurable, system-driven metrics that directly support operational decisions.
As noted by CPX:
“Global standards such as NIST SP 800-55 Revision 2 and ISO/IEC 27004 emphasize moving beyond qualitative risk descriptions toward quantitative, data-driven metrics that enable continuous monitoring and improvement.” – CPX
Executive leaders gain clear visibility into organizational risk, while analysts retain access to detailed operational data for day-to-day investigations.
What problems do they solve?
Reporting becomes fragmented faster than many organizations expect. During product audits, we’ve worked with MSSPs whose analysts exported reports from multiple security tools every week before customer reviews or leadership meetings.
After moving reporting into a single security operations dashboard, those same teams spent less time preparing reports and far more time reviewing what the data was telling them. That change alone often improves consistency across customer environments.
Some security-maturity frameworks recommend focusing dashboards on a small set of decision-useful metrics rather than overloading them with every available data point.
More charts don’t always produce better decisions. In our experience, the dashboards that deliver the most value usually highlight a smaller set of metrics that support operational and business decisions without overwhelming the people using them.
Which metrics matter most?
| Audience | Typical Metrics |
| Security Analysts | Threats, incidents, vulnerabilities |
| IT Operations | Endpoint health, patch compliance, device status |
| Executives | Risk trends, compliance posture, business impact |
NIST’s Cyber Security Metrics and Measures also recommends dashboards that let users move from executive summaries into detailed technical findings. That approach gives leadership the high-level picture while allowing analysts to investigate the underlying data whenever more context is needed.
How Do Most Security Dashboard Portals Work?
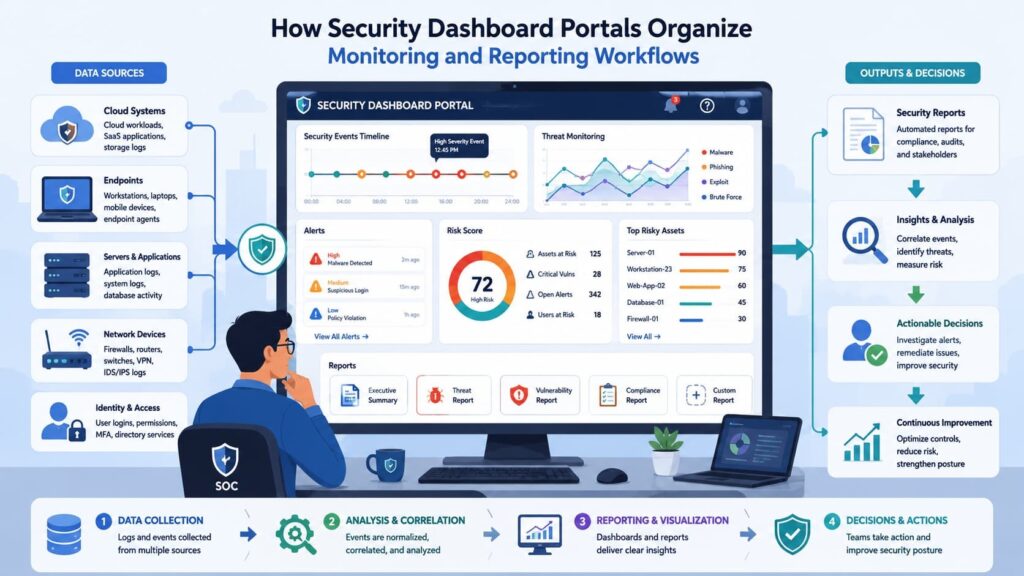
Most enterprise security portals follow a similar path before users ever see a dashboard. They authenticate, verify permissions, open the reporting area, apply filters, and then review or export the results.
Whether the environment includes cloud infrastructure, endpoints, or a hybrid deployment, that general workflow stays surprisingly consistent. Across the product evaluations and platform audits we’ve completed for MSSPs, one thing comes up again and again.
Successful reporting deployments usually depend less on the reporting features themselves and more on getting role-based access control (RBAC) right from the beginning. Different vendors organize their interfaces in different ways, but the underlying access model rarely changes.
A well-designed customer portal service interface helps users navigate reporting areas more efficiently by presenting the right dashboards, permissions, and security information based on their assigned roles.
Authentication confirms who the user is. Authorization decides what they’re allowed to see. Keeping those functions separate protects sensitive information while supporting the principle of least privilege, an approach recommended by many enterprise security frameworks.
Users typically follow a workflow like this:
- Sign in to the security portal
- Verify assigned role
- Open the reporting section
- Select the required report
- Apply filters
- Export or investigate
The steps look straightforward. Behind the scenes, though, permissions influence nearly every screen the user can access. Fully authenticated users may still see empty dashboards if their assigned role lacks reporting privileges.
It can look like a product issue at first, but the underlying cause is often a simple permission mismatch.
Why are permissions checked first?
When troubleshooting access anomalies, isolate identity from data authorization. If an analyst can log in but sees empty charts, the platform’s authentication is working, but the dataset permissions are failing.
Most modern RBAC implementations evaluate identity, organizational role, workload ownership, and, in some cases, permissions tied to individual datasets before loading reports.
NIST recommends assigning only the permissions employees need to perform their responsibilities. That least-privilege approach reduces unnecessary exposure while making security reporting easier to manage over time.
Instead of granting broad administrative privileges to resolve access issues, assign the user a dedicated read-only reporting or analytics role. This preserves least-privilege access while restoring visibility into authorized datasets.
How Do You Access Reports in Microsoft Defender?
To access your cloud posture data, authenticate into the Microsoft Defender portal (security.microsoft.com). From the left navigation pane, scroll down to Reports and select Cloud apps or Secure score.
If you land on a blank screen here despite having valid tenant credentials, your account is missing the specific Security Reader or Global Reader Microsoft Extra ID role mapping required to pull this API stream.
Available dashboards include executive summaries, cloud posture reporting, workload analysis, and customized reporting views designed for operational investigations.
Microsoft Defender cloud reporting covers supported cloud environments such as Azure and other integrated cloud workloads, depending on configuration.
Authorized users can:
- View executive summaries.
- Build custom reports.
- Duplicate existing templates.
- Export reports as PDF.
- Configure report visibility.
- Share reports according to report access rights.
One feature many organizations appreciate is flexible visibility management. Sharing and visibility depend on the tenant’s configuration and role permissions. In practice, empty dashboards often point first to permissions, licensing, or configuration rather than missing telemetry.
More frequently, they point toward incomplete report portal authentication, licensing limitations, or insufficient report viewer permissions.
Pro Tip: Before assuming data collection has failed, confirm both licensing and assigned roles. Many “missing dashboard” issues originate from authorization rather than telemetry collection.
Microsoft documentation for Defender reporting indicates that access depends on the appropriate admin or reader role for the specific reporting feature and tenant configuration.
Where Is the Google Workspace Security Dashboard?
For Google environments, log into the Google Admin Console (admin.google.com) and pivot to Security > Security Center > Dashboard. Note that this view requires the explicit Security Center Administrator privilege.
As an auditor, my favorite shortcut here is the contextual ‘View Report’ anchor located at the bottom of each widget; it lets you instantly jump from a high-level phishing trend line into raw, filterable log events without losing your date parameters.
The dashboard provides a centralized view for operational monitoring and leadership reporting. One practical benefit we have observed is how quickly administrators can pivot from high-level summaries to detailed investigations.
Instead of navigating multiple menus, users can click View Report from almost any dashboard panel to access deeper analytics. The dashboard includes several commonly used report categories:
Authentication activity
- Data Loss Prevention (DLP)
- Device security
- OAuth application activity
- Phishing attempts
- Login attempts
Users can also customize reporting periods.
Available filters include:
- Today
- Yesterday
- This week
- Last week
- This month
- Last month
- Up to 180 days of historical reporting
According to Google Workspace Admin Help, many reports support filtering across 180 days, although some datasets require additional privileges or depend on licensing.
Access to the dashboard does not necessarily mean access to every underlying report or dataset. Before assuming reports are unavailable, it makes sense to verify permissions because visibility often depends on both the assigned role and the underlying reporting service.
Why Can’t You See Security Reports?
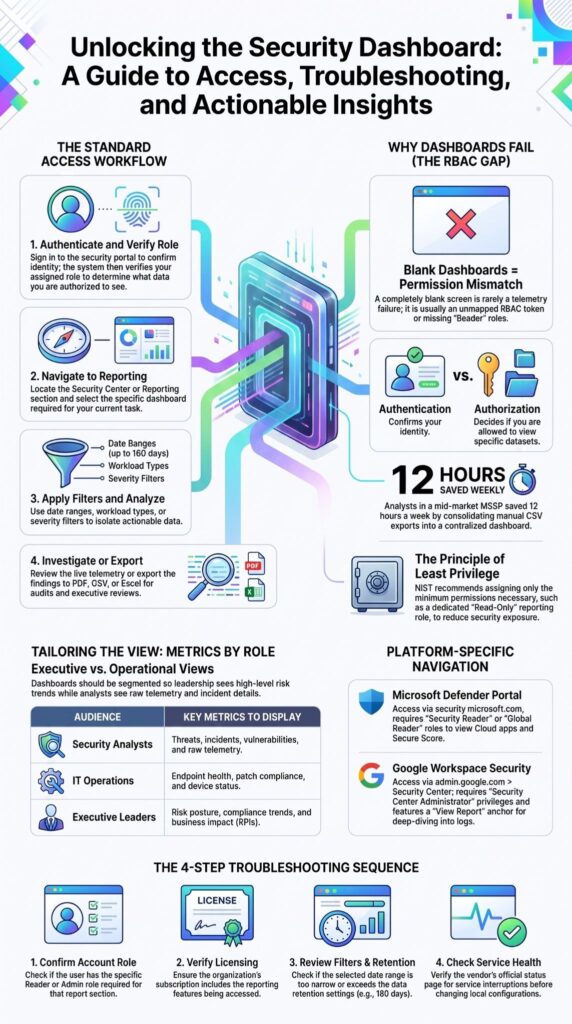
Missing permissions are a common reason security reports fail to appear, followed by licensing limitations, disabled services, and reporting delays.
When organizations contact us after encountering empty dashboards, the issue is rarely a broken security reporting system. More often, the account simply lacks the required dashboard data permissions or the reporting feature has not been enabled.
Several checks should happen before escalating the issue:
- Confirm the assigned admin or reader role.
- Verify the required subscription or license.
- Ensure reporting services are enabled.
- Confirm preview features, if applicable.
- Review data retention settings.
- Allow for reporting latency.
Community discussions across enterprise security forums also show that temporary service interruptions occasionally affect dashboard availability.
These situations are uncommon, but they remind administrators to verify vendor service health before making configuration changes. That said, not every empty dashboard indicates a technical problem.
Filters, date ranges, and recently enabled services may simply require additional time before data becomes visible.
Which Permissions Usually Block Dashboard Access?
Many administrators assume authentication alone grants access to every report. In reality, dashboard permissions, report access management, and application-specific authorization determine exactly which reports become visible.
The most common permission blockers include:
- Missing reader or analyst roles
- Table-level restrictions
- Field-level ACLs
- Dataset permissions
- Organizational security policies
Adjusting the correct read permissions resolved the issue without rebuilding dashboards. From our own deployments, we also recommend reviewing dashboard visibility settings whenever reports appear inconsistent across different users.
Two administrators may access the same portal yet see entirely different dashboards because their report viewer permissions differ.
Organizations implementing privileged access management alongside least-privilege principles generally experience fewer long-term reporting issues because permissions remain structured and easier to audit.
What Should Security Dashboards Show Management?
Executive dashboards should focus on business risk, trends, compliance, and measurable outcomes rather than overwhelming leadership with raw technical alerts. Our approach at MSSP Security is to separate executive reporting from operational investigations.
Analysts need detailed telemetry, while leadership usually benefits from concise security metrics dashboards that explain organizational risk without unnecessary technical complexity.
| Executive View | Analyst View |
| Risk posture | Alerts |
| Compliance status | Vulnerabilities |
| Trend analysis | Incident details |
| Business KPIs | Raw telemetry |
Meaningful executive KPIs often include:
- Endpoint compliance
- Patch age
- Threat score
- Open critical vulnerabilities
Incident response trends This balanced approach helps transform a security posture dashboard into a practical management tool instead of a collection of disconnected charts.
How Do You Export Reports for Audits?
Most enterprise reporting platforms support exporting reports to PDF, CSV, Excel, scheduled email delivery, or APIs for recurring audit workflows.
Security dashboards become considerably more valuable when reports can be shared with compliance teams, executives, and auditors. Effective client portal communication helps teams distribute security updates, report notifications, and audit-related information while maintaining proper access controls
Rather than recreating reports manually every month, organizations increasingly automate recurring exports through their report generation portal.
Common export options include:
- CSV
- Excel
- Scheduled email reports
- API integrations
Pro Tip: Store executive summaries separately from detailed operational investigations. This makes audit preparation much easier and prevents unnecessary exposure of sensitive technical information.
How Can You Troubleshoot Empty or Missing Dashboards?
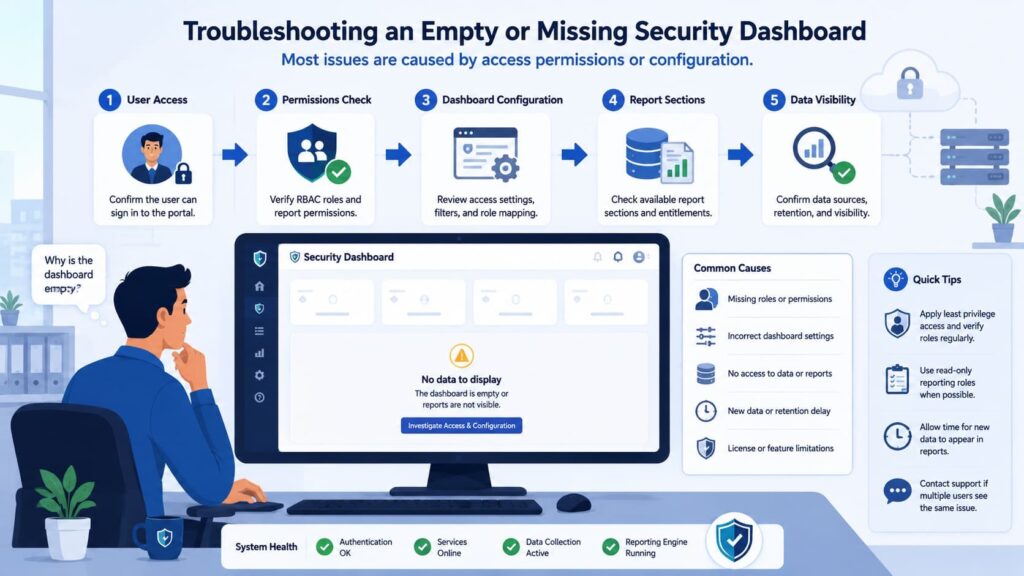
A structured troubleshooting process resolves most dashboard problems before vendor support becomes necessary. We’ve found that organizations save considerable time by following a consistent workflow instead of changing multiple settings simultaneously. Recommended troubleshooting sequence:
Confirm the assigned account role.
- Verify licensing.
- Review report filters.
- Check retention settings.
- Verify service health.
- Test another authorized account.
Contact platform support if multiple users experience the same issue. If every authorized account encounters identical errors, the issue may involve a platform outage rather than a local configuration problem.
Reviewing official service health dashboards before changing permissions helps prevent unnecessary troubleshooting. A disciplined process also creates better documentation for future incidents, making repeated issues easier to resolve.
How Can You Build a Better Security Reporting Process?
Organizations improve reporting by standardizing permissions, monitoring meaningful KPIs, and reviewing dashboards regularly.
Implementing MSSP customer portal features can improve client visibility, simplify report access management, and create a consistent reporting experience across multiple customer environments.
Technology alone rarely solves reporting challenges. Consistent governance, documented workflows, and regular permission reviews create a more reliable security reporting workflow.
Recommended best practices include:
- Apply least privilege access consistently.
- Separate executive and analyst dashboards.
- Schedule recurring reports.
- Review dashboards weekly.
- Document reporting workflows.
- Audit permissions regularly.
Research from Neumetric indicates:
“A NIST Framework Dashboard provides Organisations with a centralised & dynamic way to monitor, measure & improve Cybersecurity performance.” – Neumetric
According to NIST Cyber Security Metrics and Measures, organizations benefit most when reporting processes combine governance, measurable metrics, and continuous review rather than isolated technical monitoring.
We have seen this firsthand while supporting organizations through MSSP Security. Teams that establish standardized security reporting access control, maintain clear ownership, and regularly review dashboard visibility spend less time troubleshooting and more time improving their overall security posture.
The result is a reporting environment that supports daily operations, executive decision-making, and long-term compliance without unnecessary complexity.
Building a Cloud Security Observability Portal
Credits: Cybr
This video guide from the Cybr channel walks you through building a cloud-native security observability dashboard to monitor your infrastructure in real-time. The core focus is on extracting raw logs, parsing indicators of compromise (IOCs), and visualizing suspicious activities. You will learn how to track privilege escalations, unauthorized IAM policy modifications, and illicit user creation, ultimately consolidating these critical metrics into a centralized, secure reporting panel designed to accelerate incident detection for SOC teams.
FAQ
How do I fix security portal login problems?
Start by confirming that your security portal login credentials are correct and that your reporting portal access is active. If you still cannot access security reports, verify your dashboard access permissions, report access rights, and portal authentication flow.
Why can’t I view every security reporting dashboard?
You may not see every security reporting dashboard because your organization uses role based access control to limit access. An RBAC security portal assigns dashboard permissions based on each user’s responsibilities. Review your security dashboard role mapping, dashboard visibility settings, data access permissions, and least privilege access policy to confirm that you have the required permissions.
What should a security reporting system include?
A reliable security reporting system should include a security analytics dashboard, security monitoring dashboard, security operations dashboard, and security metrics dashboard. It should also support centralized security reporting, a structured security reporting workflow, security report management, and security reporting and monitoring so users can review security data efficiently from one location.
How can teams securely share security reports?
Teams should use secure report sharing with clearly defined report sharing permissions and report viewer permissions to control who can view or download reports. Organizations can also enable embedded report access and multi-tenant reporting while enforcing portal access control and security reporting access control to protect sensitive information and support secure collaboration.
Which dashboards are most useful for security operations?
The most useful dashboards depend on your security responsibilities and reporting needs. Many organizations use a threat detection dashboard, incident response dashboard, vulnerability reporting dashboard, security audit dashboard, risk reporting dashboard, security posture dashboard, and security insights dashboard because these dashboards provide visibility into threats, incidents, vulnerabilities, risks, and compliance activities.
Improving Access to Security Reports Dashboard Portals
Security reporting only helps when you can access the right information without delays or confusion. Start with built-in dashboards, confirm user permissions before deeper troubleshooting, and review access regularly to keep reporting reliable as your environment grows.
If you need help optimizing your security tools, improving reporting visibility, or building a more effective security stack, explore our MSSP security consulting services. Our experts provide vendor-neutral guidance, stack optimization, and practical recommendations tailored to your business goals.
References
- https://www.cpx.net/insights/blogs/security-performance-measurement-from-compliance-to-confidence-part-1/#collapseExample2
- https://www.neumetric.com/journal/nist-framework-dashboard-3539/#content