


Visualizing threat actor TTPs helps security teams understand attacker behavior through ATT&CK matrices, heatmaps, and attack graphs. At MSSP Security, we have found that visualizing tactics, techniques, and procedures improves threat intelligence analysis and supports better security decisions.
Using a threat intelligence platform (TIP), visualizing threat actor TTPs TIP helps teams organize adversary behaviors, analyze attack patterns, and turn complex intelligence into actionable insights.
Learn how MSSP Security can help strengthen your threat intelligence strategy with better visibility and security solutions.
How Does Visualizing Threat Actor TTPs Improve Threat Intelligence?
Visualizing threat actor TTPs TIP helps teams analyze threats, map attacker behaviors, and improve intelligence decisions by combining:
- Threat feeds, behavioral analysis, and security context into a unified intelligence view.
- ATT&CK mapping, attack patterns, and detection insights for better risk prioritization.
- Actionable intelligence workflows to strengthen threat detection and response.
Why Visualizing Threat Actor TTPs Improves Cyber Defense?
Visualizing threat actor TTPs gives security teams a clearer view of how attackers operate throughout an intrusion.
Instead of sorting through raw logs or lengthy reports, analysts can use threat actor TTPs visualization to connect tactics, techniques, and procedures into a single, easy-to-follow view.
This makes it easier to understand how an attack progresses and where defenses may need improvement.
Instead of analyzing isolated security events, visualizing threat actor TTPs TIP allows organizations to connect attacker behavior with intelligence sources, detection rules, and security controls.
This improves visibility into potential attack paths and strengthens cyber defense strategies.
A well-designed visualization helps organizations:
- Identify attack sequences and recurring attacker behaviors.
- Recognize techniques such as credential theft, privilege escalation, lateral movement, and data exfiltration.
- Connect related events to speed up investigations and reduce analysis time.
- Support visualizing cyber attack tactics instead of reviewing isolated alerts.
From our experience working with MSSPs, visualizations become even more valuable when they guide product evaluations and security reviews.
We often compare how different security solutions map to ATT&CK techniques, highlight detection coverage, and reveal visibility gaps before recommending changes.
This approach helps MSSPs make informed product decisions based on real attacker behavior rather than feature lists alone.
Integrating these capabilities with a structured threat intelligence workflow also helps organizations understand the Threat Intelligence Platform (TIP) Benefits, especially when collecting, analyzing, and visualizing adversary data to support faster security decisions.
The same visual context also improves communication across SOC analysts, threat hunters, incident responders, and decision-makers.
When everyone works from the same behavioral view, it becomes easier to prioritize risks, explain findings, and focus on security improvements that deliver measurable value.
Why Is MITRE ATT&CK the Foundation for Visualizing Threat Actor TTPs?
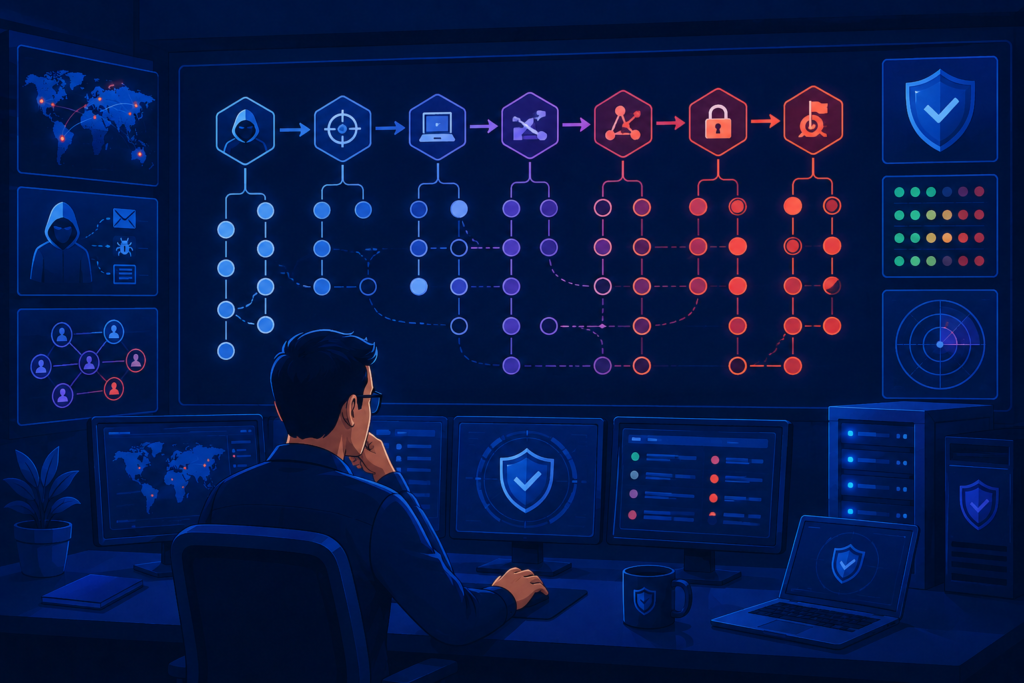
Most organizations begin visualizing threat actor TTPs with the MITRE ATT&CK framework because it offers a common way to classify attacker behavior.
Rather than focusing only on malware or indicators of compromise, ATT&CK organizes real-world adversary activity into tactics, techniques, and sub-techniques.
This standardized structure makes threat intelligence TTP mapping more consistent across security teams, tools, and environments.
When combined with a threat intelligence platform, MITRE ATT&CK provides a stronger foundation for visualizing threat actor TTPs TIP by helping analysts map adversary techniques, compare campaigns, and measure detection coverage.
The ATT&CK matrix helps organizations:
- Organize attacker techniques across every stage of an attack.
- Map observed behaviors using a standardized framework.
- Compare incidents with consistent terminology.
- Identify detection gaps and improve security coverage.
As security programs mature, MITRE ATT&CK TTP visualization becomes more than a reporting tool. It gives analysts a shared framework for understanding attack progression, validating detections, and communicating findings without relying on inconsistent internal classifications.
During product assessments for MSSPs, we frequently use ATT&CK to measure how well security solutions detect real attacker techniques instead of simply reviewing feature lists. Our evaluations often uncover visibility gaps that are difficult to spot through vendor documentation alone.
By mapping product capabilities to ATT&CK techniques, we help MSSPs select and audit security tools with greater confidence while giving both technical teams and business stakeholders a clearer view of detection coverage.
Which Visualization Works Best for Different Security Goals?
There is no single best method for visualizing threat actor TTPs. The right choice depends on what an organization is trying to accomplish, whether that is threat hunting, incident response, executive reporting, detection engineering, or evaluating security products.
Matching the visualization to the objective gives analysts a clearer picture of attacker behavior and helps teams focus on the information that matters most.
Each visualization provides a different perspective:
Choosing the right visualization method is an important part of visualizing threat actor TTPs TIP because different security goals require different perspectives, from threat hunting and incident response to security product evaluation.
Comparison of Threat Actor TTP Visualization Methods
| Visualization Method | Primary Purpose | Security Use Case | Key Benefit |
| ATT&CK Matrix Visualization | Mapping attacker tactics and techniques | Threat intelligence analysis and security assessments | Provides a complete view of adversary behavior across the attack lifecycle |
| ATT&CK Heatmap Visualization | Identifying frequent techniques and detection gaps | Risk prioritization and coverage analysis | Helps teams quickly identify high-risk attacker behaviors |
| Attack Graph Visualization | Showing relationships between techniques and attack paths | Incident investigation and threat hunting | Reveals how attackers move between systems and objectives |
| TTP Dashboard Visualization | Combining intelligence, incidents, and detection data | SOC monitoring and executive reporting | Creates a centralized view for faster security decisions |
| ATT&CK Navigator Visualization | Measuring defensive coverage and technique visibility | Red team planning, detection validation, and security reviews | Helps compare security capabilities against adversary techniques |
- ATT&CK matrix visualization shows attacker techniques across the full attack lifecycle.
- ATT&CK technique heat maps highlight commonly observed techniques and detection gaps.
- Attack graph visualization and TTP graph visualization illustrate how techniques connect during an intrusion.
- TTP dashboards and heatmaps bring together threat intelligence, detection coverage, and incident timelines.
- ATT&CK Navigator visualization supports campaign comparisons, multi-actor analysis, and coverage measurement.
“Use it to visualize defensive coverage, red/blue team planning, the frequency of detected techniques, and more.” – MITRE ATT&CK
This highlights why ATT&CK Navigator has become a valuable resource for organizations that need to compare detection coverage, analyze attacker behavior, and support both defensive planning and operational decision-making.
As we work with MSSPs to audit and evaluate security products, we have found that no single visualization answers every question.
During product assessments, we often combine ATT&CK matrices with heatmaps and dashboards to compare detection capabilities against real attacker techniques. This approach helps our clients move
How Do You Map Threat Actor TTPs Into the ATT&CK Matrix?
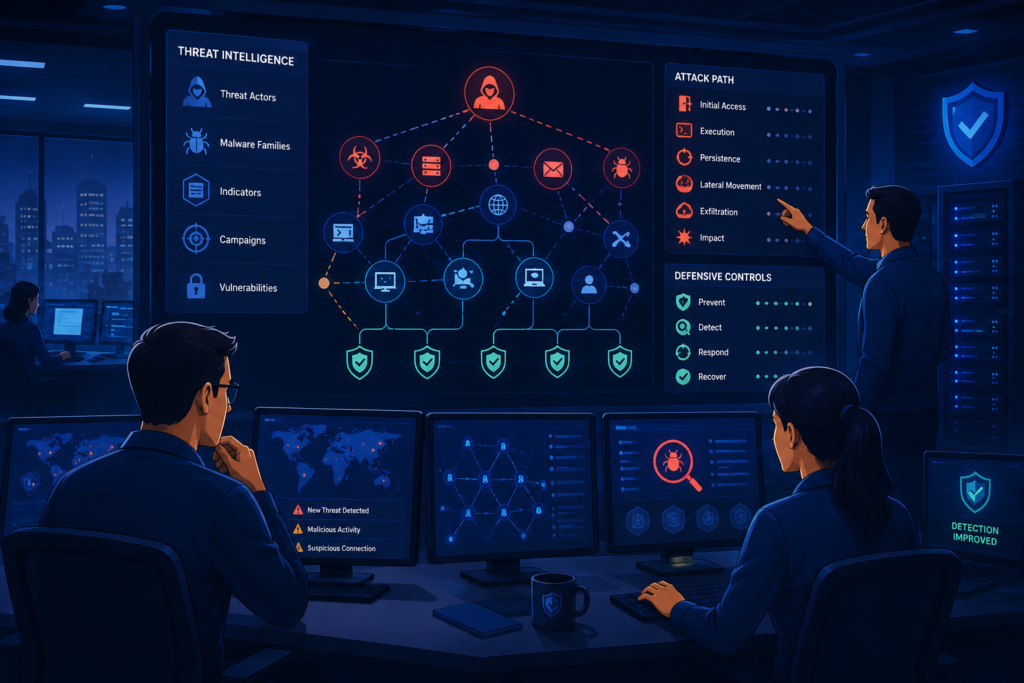
Building an accurate ATT&CK mapping is one of the most important steps in visualizing threat actor TTPs.
The process begins with collecting trusted threat intelligence from incident investigations, endpoint telemetry, network monitoring, digital forensics, and other security data sources.
Rather than mapping every event, analysts focus on confirmed attacker behaviors and align them with MITRE ATT&CK tactics and techniques. This structured approach makes mapping threat actor TTPs more consistent across teams and security tools.
A threat intelligence platform supports visualizing threat actor TTPs TIP by collecting intelligence sources and helping analysts map confirmed attacker behaviors to MITRE ATT&CK techniques with greater accuracy.
A strong ATT&CK mapping should:
- Validate each technique with supporting evidence instead of assumptions.
- Show how attackers move from initial access through impact.
- Include context such as campaign names, malware families, timestamps, or confidence levels.
- Support comparing actor TTPs visually and creating ATT&CK techniques coverage maps.
From our experience helping MSSPs evaluate and audit security products, ATT&CK mappings are most valuable when they stay current.
During assessments, we regularly compare how different solutions identify the same techniques and where detection coverage begins to differ. These reviews often reveal visibility gaps that are easy to miss when looking only at alerts or feature lists.
Keeping MITRE ATT&CK TTP visualization updated gives MSSPs a more reliable foundation for selecting security products, improving detection strategies, and adapting to changing attacker behavior.
How Can Heatmaps Help Prioritize Threat Actor Activity?
A TTP heatmap visualization is one of the simplest ways to make visualizing threat actor TTPs easier to understand.
By applying color coding to ATT&CK techniques, security teams can quickly see which attacker behaviors appear most often or present the highest level of risk. Instead of sorting through long technique lists, analysts can focus on the areas that need immediate attention.
Through visualizing threat actor TTPs TIP, heatmaps can transform large amounts of threat intelligence into visual risk indicators that help teams prioritize dangerous attacker behaviors.
Heatmaps can be used to:
- Highlight frequently observed ATT&CK techniques across incidents and campaigns.
- Support visualizing multiple threat actors by comparing behavioral patterns.
- Enable industry-specific TTP visualization for sectors such as healthcare, finance, manufacturing, and government.
- Create sector-based TTP heatmaps that reveal trends and help prioritize security investments.
When we assess security products for MSSPs, heatmaps are rarely used on their own. We often combine them with ATT&CK mappings to compare how different solutions detect high-priority techniques and where visibility begins to decline.
Those comparisons frequently reveal coverage gaps that are difficult to spot in standard reports or vendor documentation.
Another lesson we’ve learned is that technical data tells only part of the story. Heatmaps become far more valuable when organizations include business context, such as critical assets, detection maturity, or operational impact.
That combination helps MSSPs evaluate security products more objectively while ensuring that the most important attacker techniques receive the attention they deserve.
How Can You Connect TTPs With Incidents, Detection Rules, and Security Coverage?
Effective visualizing threat actor TTPs goes beyond mapping attacker techniques on the ATT&CK matrix. The real value comes from showing how those techniques connect to security incidents, detection rules, response playbooks, and existing controls.
Bringing these pieces together gives analysts the context they need to understand not only what happened, but also how well their defenses responded.
A TIP improves visualizing threat actor TTPs TIP by connecting threat intelligence, incidents, detection rules, and security controls into a centralized operational view.
A connected visualization helps organizations:
- Improve threat intelligence TTP mapping by linking incidents to ATT&CK techniques.
- Link TTPs to incidents visually to reconstruct attack progression.
- Support visualizing attack procedures instead of reviewing isolated security alerts.
- Build ATT&CK coverage visualization and TTP coverage visualization in SIEM to identify detection gaps.
“ATT&CK can be used to identify defensive gaps, assess security tool capabilities, organize detections, hunt for threats, engage in red team activities, or validate mitigation controls.” – CISA
This reflects how ATT&CK visualization extends beyond reporting and becomes a practical framework for improving detection coverage and day-to-day security operations.
Throughout our work with MSSPs, we have found that this type of mapping is especially valuable during product evaluations.
Rather than reviewing detection features in isolation, we compare ATT&CK techniques against SIEM rules, endpoint detections, and SOC workflows to see how each solution performs in real scenarios. Those assessments often uncover blind spots that are not obvious in vendor documentation.
Over time, we’ve also learned that a unified view delivers better results than separate reports.
Combining incident data, ATT&CK mappings, and detection coverage into a single dashboard helps MSSPs measure product effectiveness, prioritize new detection use cases, and make product selection decisions based on actual security coverage instead of marketing claims.
This approach also highlights the benefits using tip security operations by helping teams centralize threat intelligence, improve detection workflows, and connect attacker behavior with existing security controls.
How Can You Visualize TTP Relationships Across the Attack Lifecycle?
One of the biggest benefits of visualizing threat actor TTPs is seeing how attacker behaviors connect from the first point of access to the final objective. Instead of analyzing each technique on its own, security teams can follow the sequence of actions an adversary takes throughout an intrusion.
This broader view helps analysts investigate incidents more efficiently and gives threat hunters a better understanding of what attackers are likely to do next.
Effective visualizing threat actor TTPs TIP helps analysts understand relationships between attacker techniques, compromised assets, and attack stages instead of reviewing individual events separately.
Relationship-based visualizations can help organizations:
- Combine MITRE ATT&CK TTP visualization with the Cyber Kill Chain.
- Support mapping TTPs to the kill chain across each attack phase.
- Use TTP graph visualization to connect techniques, compromised assets, and user accounts.
- Improve visualizing TTP relationships and visualizing TTP chains and sequences during investigations.
Many of the product evaluations we perform for MSSPs include reviewing how security platforms represent attack progression.
We often compare whether a solution can link related ATT&CK techniques, correlate events across different data sources, and clearly show how an intrusion develops over time.
These capabilities usually provide more value than dashboards that display techniques as separate events.
Our experience has shown that relationship-based visualization frequently exposes coverage gaps that standard reports overlook.
When organizations can trace attacker movement from credential access and persistence to privilege escalation and lateral movement, they gain a clearer understanding of attacker playbooks.
That insight helps MSSPs choose security products with stronger investigative capabilities while improving threat hunting, incident response, and long-term detection planning.
What Are the Best Practices for Creating Actionable Threat Actor TTP Visualizations?
Effective visualizing threat actor TTPs is not about creating the most detailed dashboard. The goal is to present threat intelligence in a way that helps analysts, security leaders, and other stakeholders make informed decisions.
A well-designed visualization should simplify complex data, highlight what matters most, and support day-to-day security operations.
Successful visualizing threat actor TTPs TIP requires accurate intelligence sources, consistent ATT&CK mapping, and clear dashboards that help different security teams make informed decisions.
Some proven TTP visualization best practices include:
- Use consistent ATT&CK mappings, labels, and color schemes across reports.
- Prioritize coloring TTPs by risk level so critical techniques stand out.
- Enable drill-down visualization for TTPs to connect dashboards with incidents, evidence, and detection rules.
- Build TTP dashboards and heatmaps that emphasize attacker behavior, detection coverage, and business impact.
- Track TTP trends over time to measure changes in attacker activity and defensive coverage.
As we evaluate security products for MSSPs, we pay close attention to how each platform presents threat data.
We have found that dashboards with clear ATT&CK mapping, useful annotations, and flexible filtering are far more valuable than interfaces packed with excessive charts and metrics.
The best products help analysts move from a high-level overview to detailed evidence without losing context.
Over the years, our product assessments have shown that the most effective visualizations support operational decisions rather than visual appeal.
When dashboards focus on meaningful context instead of displaying every available technique, MSSPs can compare products more accurately, identify coverage gaps faster, and recommend security improvements with greater confidence.
What Common Mistakes Reduce the Value of TTP Visualization?
Credit: Level Effect
Even the best efforts at visualizing threat actor TTPs can fall short when the underlying approach is not well planned.
A visualization should help analysts understand attacker behavior quickly, not force them to sort through unnecessary information. When dashboards become cluttered or outdated, they often make investigations slower instead of more effective.
Poor implementation of visualizing threat actor TTPs TIP can reduce visibility when organizations rely on outdated intelligence, excessive dashboards, or incomplete attacker behavior mapping.
Some of the most common mistakes include:
- Filling dashboards with too many ATT&CK techniques, indicators, and metrics.
- Relying on outdated threat intelligence or stale MITRE ATT&CK TTP visualization data.
- Prioritizing indicators of compromise instead of visualizing adversary techniques.
- Overlooking visualizing detection gaps and ATT&CK coverage visualization, leaving important techniques without reliable monitoring.
Across the product assessments we perform for MSSPs, we have seen these issues appear more often than expected.
A platform may offer extensive reporting features, but if analysts cannot quickly identify attacker behavior or understand detection coverage, those features add little value.
Comparing products side by side often reveals that the most effective solutions focus on clarity instead of presenting every available metric.
Another lesson we have learned is that useful visualizations require ongoing maintenance. As attacker techniques evolve, ATT&CK mappings and detection coverage need regular updates to remain accurate.
Keeping behavioral data current gives MSSPs a stronger foundation for evaluating products, improving detection strategies, and making security decisions based on real operational visibility rather than outdated information.
How Can Threat Actor TTP Visualizations Drive Continuous Security Improvement?
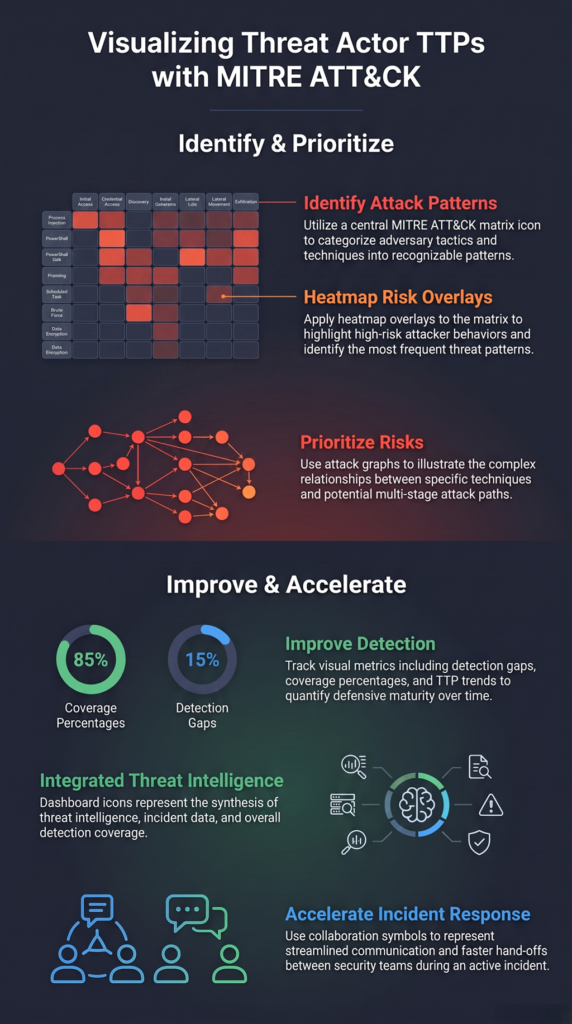
Getting lasting value from visualizing threat actor TTPs requires more than creating a dashboard and leaving it unchanged. Attacker techniques evolve, detection capabilities improve, and security products introduce new features over time.
As those changes happen, ATT&CK mappings, heatmaps, and dashboards should be reviewed regularly so they continue to reflect the current threat landscape.
Continuous visualizing threat actor TTPs TIP helps organizations update threat intelligence, monitor attacker behavior changes, and improve security operations over time.
A continuous improvement process should include:
- Reviewing recent incidents and updating threat intelligence TTP mapping.
- Monitoring TTP trends over time to spot changes in attacker behavior.
- Using ATT&CK techniques coverage maps to measure detection progress.
- Comparing actor TTPs visually to identify emerging campaigns and refine detection priorities.
In our consulting work with MSSPs, product evaluations are never treated as one-time engagements. We routinely revisit ATT&CK mappings during security tool audits to determine whether a platform still provides the visibility and detection coverage our clients expect.
These reviews often reveal new ATT&CK techniques that require additional monitoring or highlight products that have improved their detection capabilities through recent updates.
For organizations evaluating new security investments, this continuous review process is also valuable when choosing tip vendor solution in Fullerton, as it provides a clearer understanding of how different platforms support threat visibility, detection coverage, and operational requirements.
The same mindset applies to day-to-day security operations. SOC analysts, threat hunters, and security leaders all benefit when they work from the same behavioral view of attacker activity.
We have found that organizations make better product decisions and strengthen their overall security posture when visualizing threat actor TTPs becomes part of an ongoing review process instead of a static report that is rarely updated.
FAQ
What Does Visualizing Threat Actor TTPs Mean?
Using a threat intelligence platform (TIP) for visualizing threat actor TTPs TIP helps teams organize adversary behaviors, connect intelligence data, and improve defensive actions.
Why Is MITRE ATT&CK Commonly Used for TTP Visualization?
The MITRE ATT&CK framework provides a standardized knowledge base of adversary behaviors observed in real-world attacks. Because techniques are organized into tactics and sub-techniques, MITRE ATT&CK TTP visualization allows organizations to map, compare, and analyze attacker behavior consistently across different incidents and campaigns.
What Are the Best Visualization Methods for Threat Actor TTPs?
The best method depends on the objective. ATT&CK matrix visualization is ideal for behavioral mapping, TTP heatmap visualization highlights priority techniques, attack graphs reveal relationships between techniques, and dashboards combine threat intelligence, detection coverage, and incident data into a single operational view.
How Can Organizations Improve Their TTP Visualizations?
Organizations should regularly update ATT&CK mappings, validate threat intelligence, prioritize high-risk techniques, visualize detection coverage, and simplify dashboards for different audiences. Combining multiple visualization methods often provides a more complete understanding of attacker behavior than relying on a single reporting format.
How Does TTP Visualization Support Threat Hunting?
Threat hunters use visualizing threat actor TTPs to identify behavioral patterns that indicate adversary activity. By mapping techniques to ATT&CK, comparing historical campaigns, and analyzing attack chains, security teams can develop more targeted hunting hypotheses and improve detection of sophisticated threats before they escalate.
How Can Visualizing Threat Actor TTPs Strengthen Cyber Defense?
Visualizing threat actor TTPs helps organizations transform complex threat intelligence into actionable insights. Using MITRE ATT&CK TTP visualization, heatmaps, and dashboards, security teams can understand attacker behavior, improve detection coverage, and prioritize risks.
A TIP enhances visualizing threat actor TTPs TIP by connecting intelligence data, analyzing adversary activity, and supporting stronger security decisions.
In our experience working with MSSPs, maintaining updated visualizations helps improve product evaluations, security operations, and defensive strategies.
For vendor-neutral guidance on evaluating security tools, optimizing your security stack, and improving visibility, explore MSSP Security’s consulting services to build more effective security operations.
References
- https://attack.mitre.org/resources/
- https://www.cisa.gov/news-events/news/best-practices-mitre-attckr-mapping