Address
304 North Cardinal St.
Dorchester Center, MA 02124
Work Hours
Monday to Friday: 7AM - 7PM
Weekend: 10AM - 5PM
Address
304 North Cardinal St.
Dorchester Center, MA 02124
Work Hours
Monday to Friday: 7AM - 7PM
Weekend: 10AM - 5PM
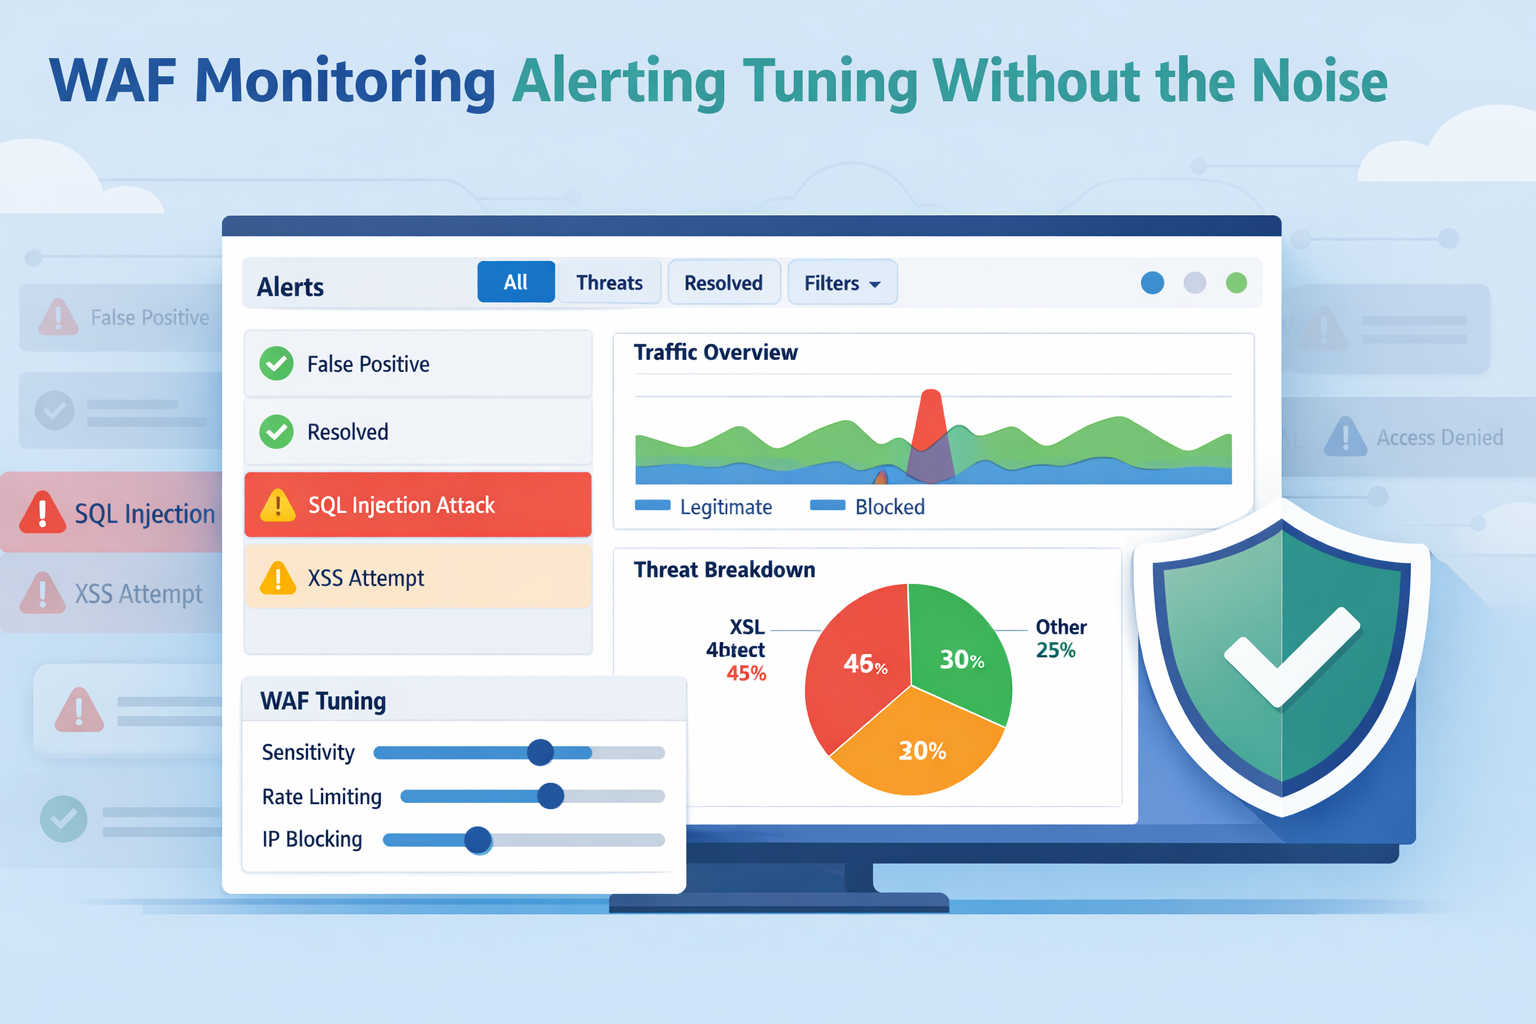
WAF monitoring, alerting, tuning are what make a firewall useful in real life. We can deploy a strong WAF, but without operating it well, it becomes an expensive traffic viewer. We’ve seen this firsthand. The real defense comes from watching traffic patterns, getting alerts that matter, and adjusting rules so they block attackers without frustrating legitimate users.
Teams that run this cycle well deal with fewer false alarms, fewer late-night escalations, and clearer security signals. This is the daily work we support through MSSP Security with practical guidance for MSSPs. Keep reading to see how it works.
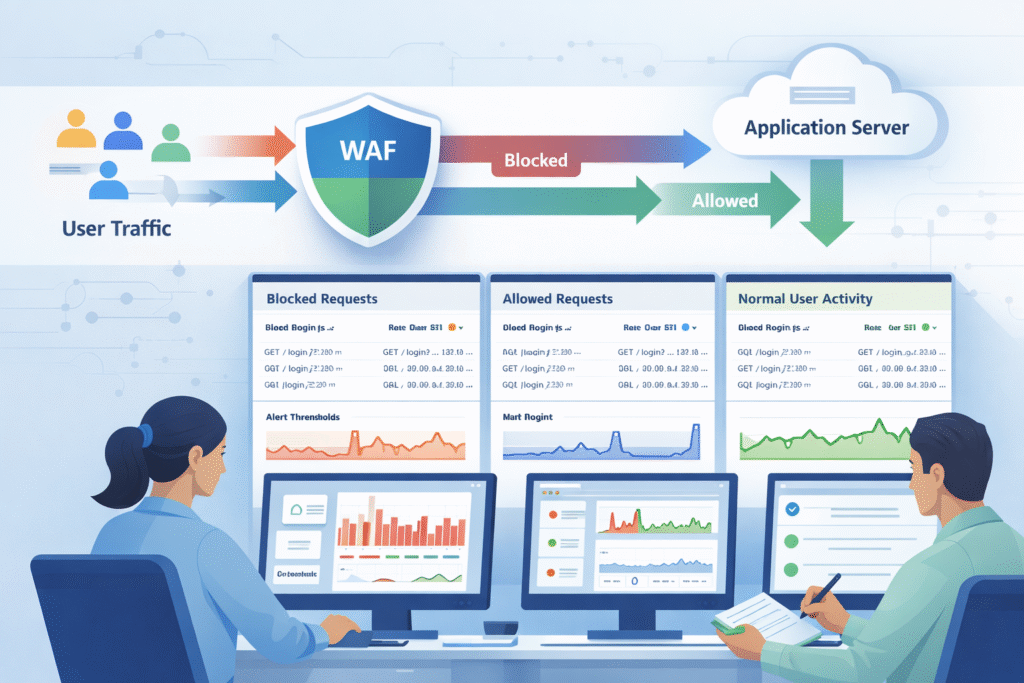
In practice, it all starts with the logs. Every single hit to our application, blocked or allowed, gets recorded. Those logs feed into dashboards and support the kind of 24/7 firewall monitoring and alert coverage that helps teams spot patterns early instead of reacting after damage is done.
But the secret sauce is baselining. For the first week or two, we run the WAF in detection-only mode. We’re not blocking anything yet; we’re just learning what “normal” looks like for our specific app.
Once we know normal, anomalies stick out. A sudden spike in requests from a new region, or a weird payload pattern, will trip a wire. From our work with MSSPs, the teams that succeed make this a daily habit. They review their dashboards with the application owners, not in a silo. It’s a conversation, not a report.
Key monitoring components we’ll need:
Get the monitoring right. Without it, everything that comes next is just a guess.
Credits: LearnCantrill
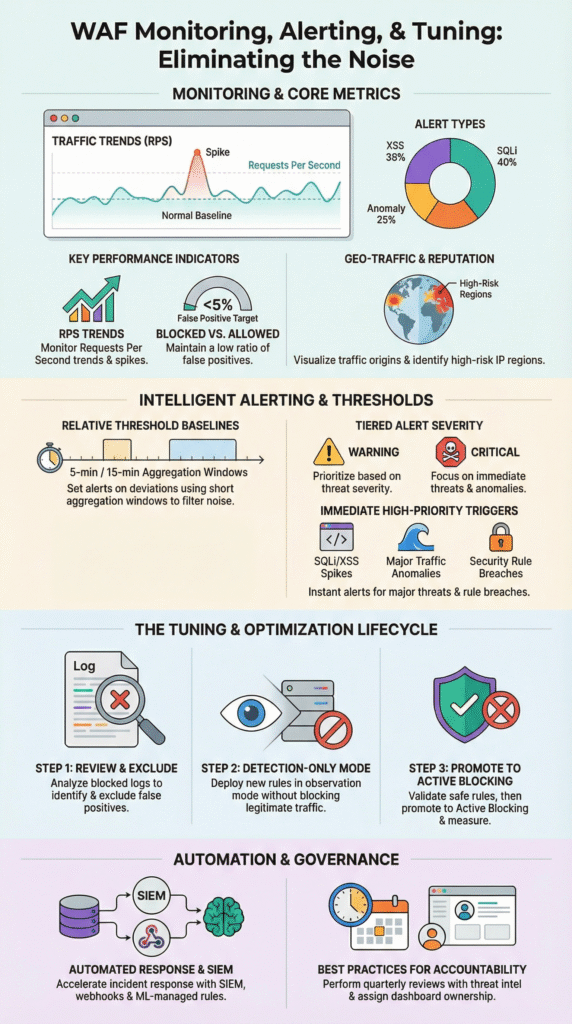
We’ll see a dozen metrics, but only a few tell the story. Request rate is our first clue, requests per second (RPS) shooting up can signal a volumetric attack before anything else breaks.
Then, look at our rule matches. A sudden jump in SQL injection or cross-site scripting (XSS) hits usually means an automated scanner has found us. It’s not a user mistake; it’s a probe.
The block vs. allow ratio is our report card. Industry benchmarks suggest mature teams keep false positives, legitimate users getting blocked, under 5%. If that number creeps up, our tuning is off.
Don’t forget latency. It sounds like a performance metric, but a WAF rule adding even 50 milliseconds of delay can hurt conversions. Our users will feel it. And watch the map. Traffic from an unexpected country or a suspicious ISP (ASN) is often a sign of bots or an abuse campaign.
We always track rule hit trends, too. If a specific rule starts firing ten times more than usual, even if overall traffic is flat, we want to know why. It could be a new feature launch or a new attack method.
Focus on these high-value metrics:
Metrics are useless if no one looks at them. Build trust in the dashboard, or it becomes wallpaper.
Set them to catch abnormal patterns, not just high numbers. Use tiered thresholds and aggregation windows to fight alert fatigue.
The biggest mistake is using a fixed number. “Alert me at 10,000 requests per hour.” That doesn’t work. If our baseline is 1,000 RPS, 10,000 is an emergency. If our baseline is 9,500, it’s Tuesday. Thresholds have to be relative.
Most teams we work with use a tiered model. A ‘warning’ alert might fire when traffic hits 80% above the baseline. A ‘critical’ alert kicks in at 100% over baseline, sustained for a few minutes.
Aggregation is our friend. Set alerts to aggregate over a 5 or 15-minute window. This filters out those brief, meaningless spikes that resolve on their own and just spam our inbox. And have a clear escalation path. A critical alert should route directly to a similar on-call system.
“The average request per second (in five-minute segments) of all clients compared with the rate category’s configured average threshold and burst threshold. As a general rule of thumb we shouldn’t increase the threshold beyond 20 requests per second. If we find we need to, then our category definition is insufficient.” – Akamai [1].
A solid alert setup looks like:
Well-tuned alerting protects our analysts as much as our applications. Burnout is a security risk.
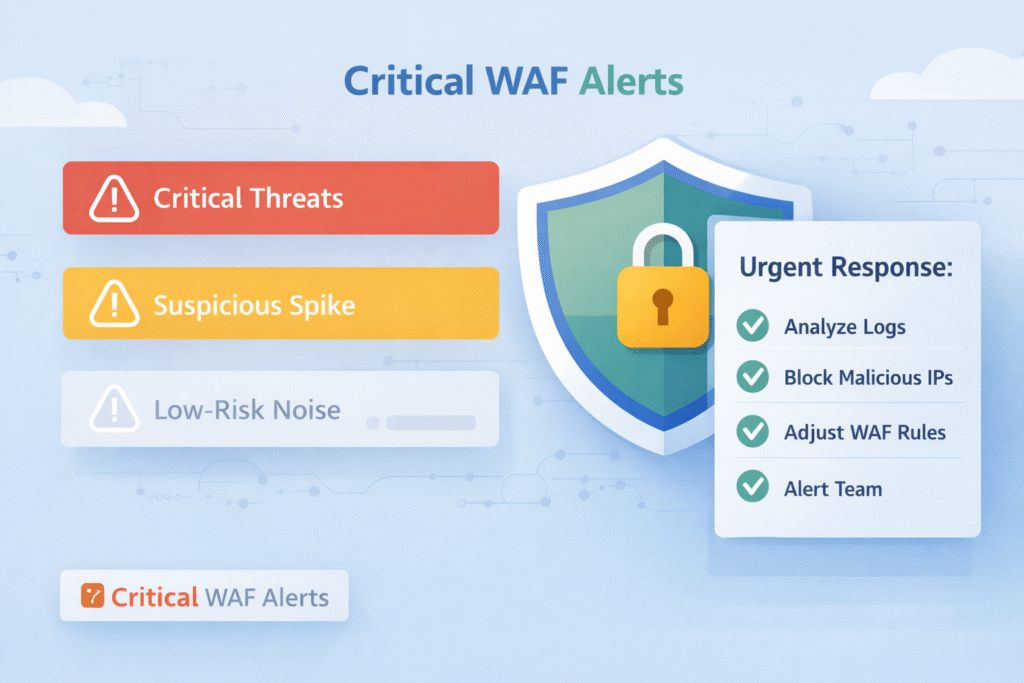
High-confidence attack patterns and major traffic anomalies. These need a fast response to limit damage and downtime.
The most urgent alerts scream “malicious intent at scale.” Something like SQL injection attempts exceeding 100 per hour. That’s almost always an automated attack campaign, not a curious user. Teams using Splunk for correlation see this pattern all the time.
Traffic anomalies are next. A sudden flood of requests can overwhelm our servers, even if each request looks harmless. This is a denial-of-service in the making.
Here’s one that surprises people: false positive alerts. If a large number of legitimate users start getting blocked, that’s a business-impacting outage. It requires an immediate rollback or rule adjustment.
And pay close attention to custom rule breaches. These rules often protect the unique logic of our application, a special checkout flow, a proprietary API. A breach here can mean someone is probing our crown jewels.
| Alert Type | Typical Trigger | Immediate Action |
| Attack Volume | SQLi or XSS spikes >100/hour | Investigate source IPs, confirm blocks are working. |
| Traffic Anomaly | RPS more than 2x the baseline | Apply rate limits, scale resources, analyze logs. |
| False Positives | Legitimate IPs blocked repeatedly | Review the offending rule, add temporary exclusions. |
| Custom Rule Breach | Unique business logic threshold exceeded | Validate if it’s an attack or a bug, adjust tuning. |
We help MSSP clients review these alerts after every incident. It’s how we refine our thresholds and build better playbooks for next time. The goal of an immediate alert is containment first. Analysis and fine-tuning come right after we’ve stopped the bleeding.
It uses real traffic data to adjust rules and thresholds, letting the bad stuff get blocked while good traffic flows through smoothly.
Tuning isn’t magic, it’s a process. And it always starts with data. A well-run managed Web Application Firewall (WAF) gives teams the structure to refine rules gradually while keeping legitimate traffic flowing smoothly.
Step one is reviewing the blocked requests. Our analysts need to dig in and find patterns: “Oh, our new mobile app is sending a payload that looks like SQL injection to Rule #94201.” That’s a false positive.
Next, we create exclusions or adjust rule scoring. Maybe we whitelist that specific parameter from that specific user agent. The key is to be surgical, don’t turn off the whole rule, just carve out the exception.
Roll out changes gradually. Move the updated rule back to detection-only mode for a bit. Watch the logs. Did the false positives stop? Is it still catching real attacks? Platforms Web Application Firewall are built for this staged approach.
Then, and only then, promote it to active blocking. This creates a feedback loop: change, measure, adjust.
The teams we see that tune weekly have far fewer “oh no” moments and emergency rollbacks than those who only look at their rules quarterly. It becomes routine maintenance.
A practical tuning workflow:
The goal is a measurable drop in false positives. Getting that number consistently under 5% is the mark of a mature program.
When we’re learning what’s normal or testing a change. It’s a safe space to observe without the risk of blocking good traffic.
The most obvious time is with a new application. Flip the WAF to detection-only and let it soak for a week or two. We’ll learn its unique traffic patterns without causing a single user error.
Any rule update, even a minor one, deserves a spin in detection mode. We might think we know what it will do, but production traffic is full of surprises. This is our safety net.
Think about seasonal shifts, too. A big sale or a marketing campaign can change our traffic dramatically. Putting relevant rules into detection-only for the event’s duration prevents our security from accidentally killing our promotion.
We’ve even used detection mode for post-mortems. After a real incident, we can replay the attack traffic safely to test a new defensive rule before we enforce it.
Common uses for detection-only mode:
Detection mode isn’t passive. It’s an active learning phase that makes our eventual blocking decisions smarter and more precise.
It speeds everything up. Automation connects dots between systems and triggers actions, so we find and fix problems faster.
Start by integrating our WAF with a SIEM. This correlates alerts with broader activity and pairing that with a strong log monitoring alerting service ensures the signal stays clear even when traffic volume spikes.
We can script automated responses. If a traffic spike alert fires, a webhook could automatically trigger our cloud platform to add more servers. Or it could temporarily block a suspicious IP range. This contains issues while the coffee’s still brewing.
Then there are machine-learning managed rules. These use analytics to adjust themselves based on observed traffic, taking a chunk of the manual tuning load off our plate. Research from the Elastic ecosystem suggests this kind of automation can cut response times by 30-50%.
Automation also brings consistency. Every incident follows the same triage and response steps, which reduces human error.
In our work, automation lets the analysts we support focus on the hard stuff, the strategy, the complex attack chains, instead of getting bogged down in repetitive log sifting.
Ways to bring automation in:
Automation doesn’t replace human expertise. It amplifies it, giving experts more time to be expert.
Schedule quarterly audits of our rules and alerts. That rule we wrote six months ago to stop a specific exploit might be obsolete now, or it might be catching a new feature. A regular review resets our assumptions.
Dashboards need an owner. Someone has to be accountable for checking them, understanding the trends, and asking “why?” when something changes. If no one owns it, it decays.
Incorporate threat intelligence. Subscribing to feeds that highlight new attack patterns helps we decide which of our fifty alerts should be prioritized this month. Is everyone talking about a new PHP framework exploit? Maybe bump those related alerts to critical.
Context is everything. A WAF alert about suspicious activity is one thing. A WAF alert about suspicious activity from a user who just authenticated as an admin is a whole different level of urgent. Correlate with our identity and application data.
“Looking at attacks in the context of a complete security incident, and not only a single request or a session, helps us solve the false positive issue. The model described in this post considers only the metadata of a group of alerts. It does not use the content of a single alert.” – Imperva [2]
For us, the most successful MSSP programs treat alert quality as a key performance indicator. They track not just “how many alerts,” but “how many required action” and “how quickly were they resolved.”
Sustainable practices to keep alerts sharp:
Actionable alerts are built through consistent effort. They’re a living part of our security posture.
Most teams should review WAF monitoring data every day to detect threats quickly. Web application firewall monitoring works best when we track baseline traffic, rule match monitoring, and blocked requests alerting together. Daily WAF log analysis helps we notice unusual patterns before they turn into real attacks. A weekly deep review improves anomaly detection and strengthens long-term security.
Effective WAF alerting requires careful WAF alert configuration so teams only receive meaningful alerts. Multi-tier alerting helps separate critical threats from low-risk events. We should prioritize rate limiting alerts, SQL injection monitoring, and XSS attack alerting. Risk-based alerting also supports alert fatigue reduction and improves response time. A clear WAF metrics dashboard keeps monitoring organized.
WAF tuning helps block real attacks while allowing legitimate traffic through. WAF rule tuning and WAF threshold tuning reduce unnecessary blocks and improve accuracy. False positive reduction often involves adjusting WAF exclusion lists and refining whitelisting tuning for trusted users. Monitoring rule hit rate ensures that changes remain effective. Strong WAF rule optimization also lowers false negatives.
A useful WAF metrics dashboard must display key security and performance signals in real time. It should include WAF traffic analysis, blocked versus allowed requests analysis, and WAF performance metrics. QPS monitoring and RPS alerting help prevent overload conditions. Tracking latency impact ensures the firewall does not slow applications down. Capacity thresholds also support stable operations.
A team should perform a full WAF post-incident review after any serious attack or major traffic spike. This review must examine DDoS mitigation tuning, HTTP flood detection results, and bot management tuning effectiveness. Security teams should update custom rule alerting and incorporate threat intelligence WAF insights. Regular quarterly WAF audits and staging testing keep tuning accurate over time.
WAF monitoring, alerting, and tuning work best as a continuous cycle, not a one-time checklist. Monitoring builds visibility, alerting supports fast response, and tuning improves accuracy over time. Through MSSP Security, we have seen that disciplined metrics, threshold reviews, and regular iteration reduce noise while strengthening protection.
We offer expert consulting tailored for MSSPs, including vendor-neutral product selection, auditing, stack optimization, and clear recommendations backed by 15+ years of experience and 48K+ projects completed. Join us here.
