MSSP SOC process flow diagram is a practical map of how a provider detects, investigates, and stops threats across many clients. It follows a clear lifecycle, often aligned with NIST 800-61. When teams outsource monitoring, they want visibility into how alerts move and get resolved.
A solid process improves MTTD and MTTR while keeping service levels steady. In our work with MSSPs, we’ve seen this diagram reflect real operations, not just policy slides. It shows how analysts actually work day to day and where gaps appear. Keep reading to see what each stage really looks like.
MSSP SOC Process Flow Diagram Highlights
- The diagram standardizes how an MSSP handles threats for many clients, following phases like detection, triage, and response.
- Good workflows balance people, process, and technology, using tools like SIEM, EDR, and SOAR effectively.
- The whole system needs constant tweaking based on feedback. This cuts down false alarms, speeds up response times, and keeps the security analysts from burning out.
What is an MSSP SOC Process Flow Diagram?
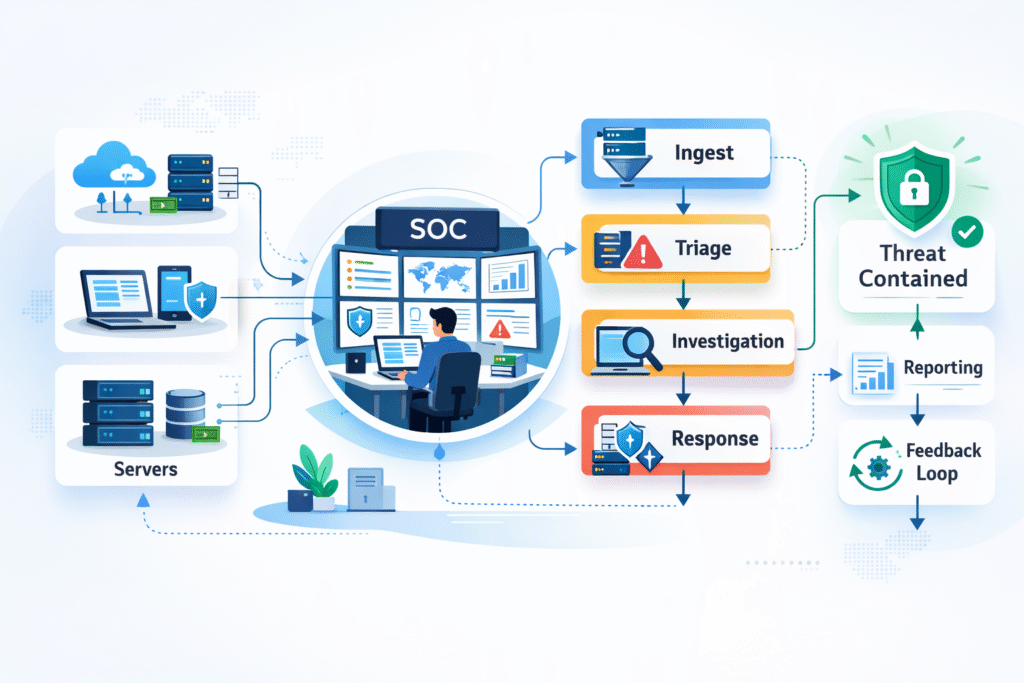
An MSSP SOC process flow diagram lays out exactly how a security team manages the entire life of a potential threat, from the first blip on the radar to final cleanup. It’s modeled after trusted frameworks, most commonly NIST’s incident handling guide.
Practically speaking, it maps the security operations center workflow. It defines where all the security data pours in and how alerts get sorted by junior analysts. When serious issues get kicked up to experts who run a predefined incident response playbook.
The diagram must show strict isolation between clients and clear paths for SLA compliance workflows. You’ll usually see a few core things:
- The 24/7 monitoring pipeline pulling data from networks, endpoints, and cloud services.
- A clear escalation path from Tier 1 to Tier 2 to Tier 3 analysts.
- Loops that feed information from finished cases back into the system to tune out false alarms.
- Tracked metrics like Mean Time to Detect (MTTD) and Mean Time to Respond (MTTR).
We’ve reviewed diagrams that promise 15-minute detection, but the real-world process took 48 hours because the escalation steps were muddy. The diagram only adds value if it reflects reality.
What are the Core Components of an MSSP SOC?
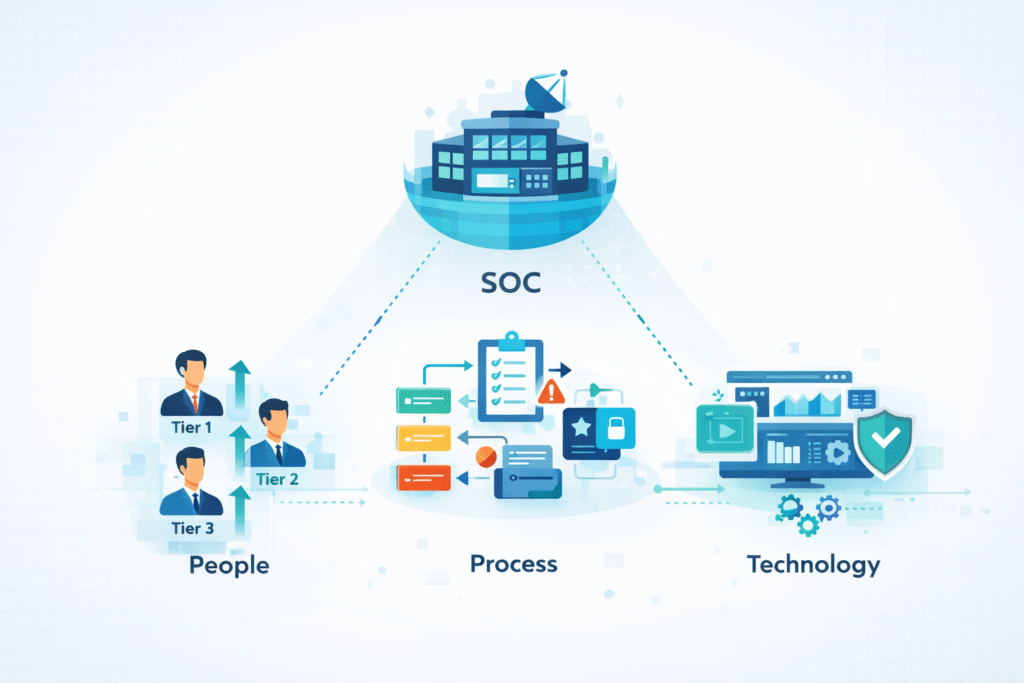
An MSSP SOC stands on three pillars: the people, the processes they follow, and the technology that enables it all. This structure is built to meet service agreements and scale.
People: The Tiered Escalation Model
A mature SOC uses a tiered system to manage the flood of alerts and prevent overwhelm.
- Tier 1 Analysts do the initial triage. They filter out the noise and validate if an alert is worth a deeper look.
- Tier 2 Investigators take over for confirmed alerts. They correlate data, hunt for root causes, and figure out the scope.
- Tier 3 Experts handle the big stuff. They lead forensics, direct containment, and manage critical incidents.
SANS Institute research points out that a poorly tuned security system can create thousands of daily alerts. Without good Tier 1 filtering, this leads directly to analyst burnout. We’ve seen it firsthand.
Building workflows to prevent burnout isn’t a nice-to-have; it’s a core part of the architecture. Strong tiering and clear escalation paths reinforce the broader role of SOC in cybersecurity, especially when defending multiple clients at once.
Process: The SLA-Driven Workflow
The process defines the “how.” It’s the set of instructions that moves an incident from detection to closure, all within the timelines promised to the client.
Key processes include:
- The client onboarding procedure to get their data flowing in correctly.
- The escalation matrix that dictates who gets called and when.
- The execution of specific incident response playbooks for different threat types.
- The post-mortem analysis to learn and improve after an incident.
Clear SLAs aren’t just contract terms. They’re tied to data breach laws and compliance audits. If the process doesn’t support the SLA, the diagram is just decoration.
The Technology Stack
Technology is what makes the workflow possible at scale.
| Layer | What It Does | Common Example |
| SIEM | Collects and correlates log data from everywhere. | Splunk, Sentinel |
| EDR | Monitors and protects endpoints (laptops, servers). | CrowdStrike, Microsoft Defender |
| SOAR | Automates repetitive response tasks. | Splunk SOAR, Cortex XSOAR |
| Threat Intel | Provides context on attacker methods. | Feeds integrated with MITRE ATT&CK |
The right tech enables growth, but without the right structure, it just creates a more organized kind of chaos.
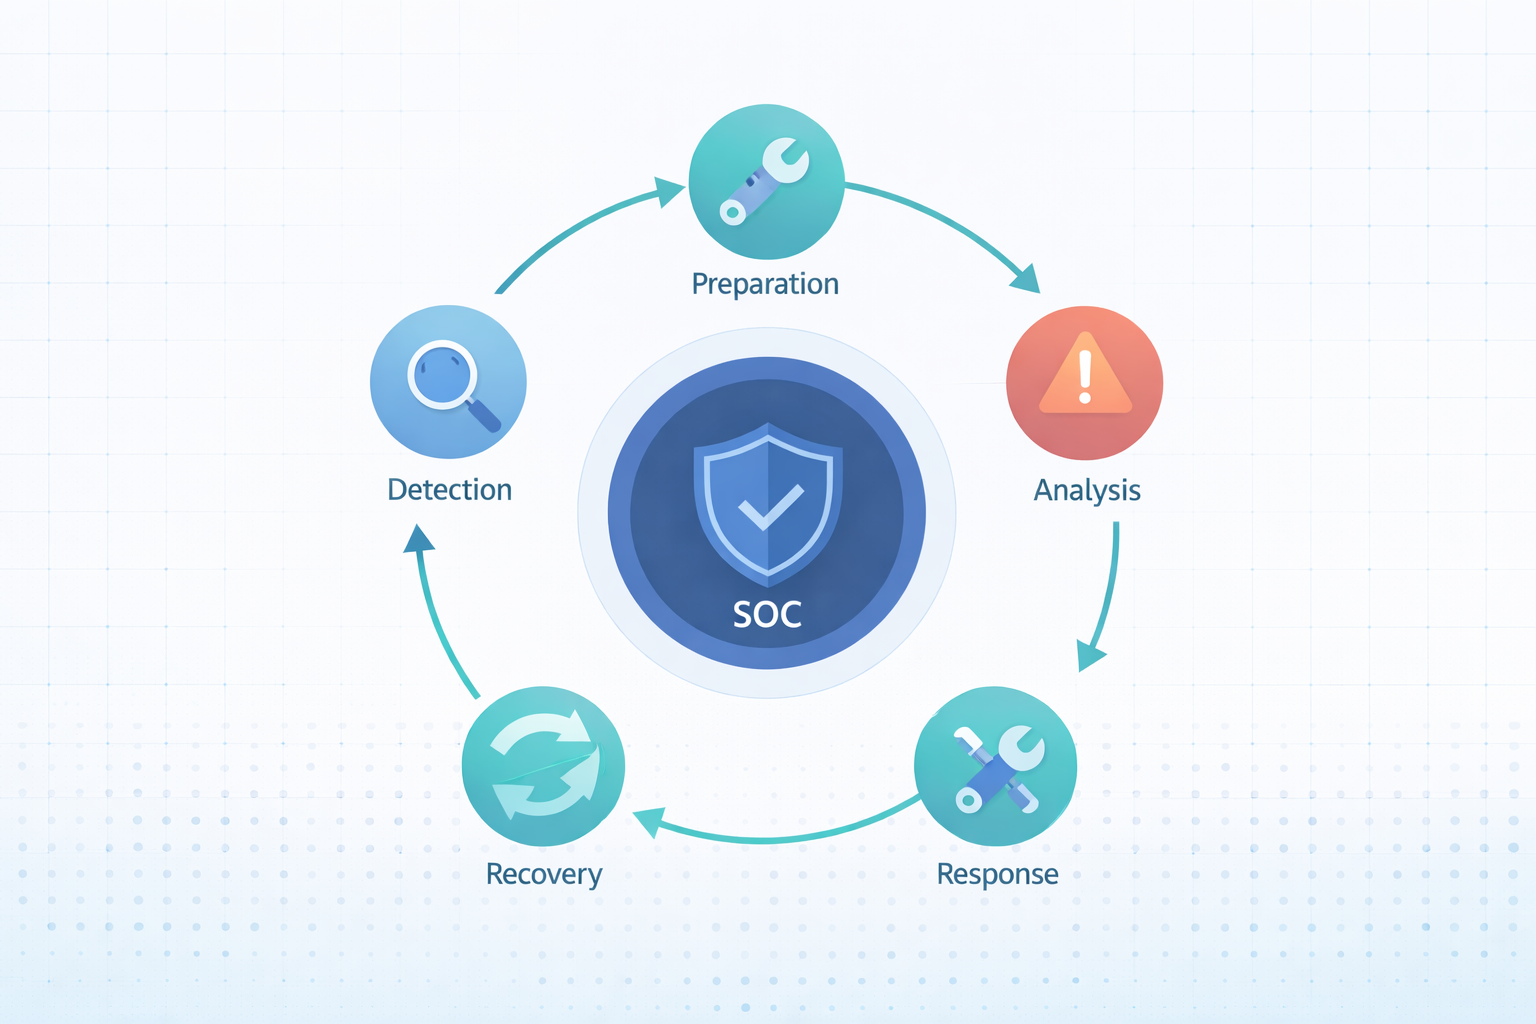
How Does the Standard MSSP SOC Process Flow Work?
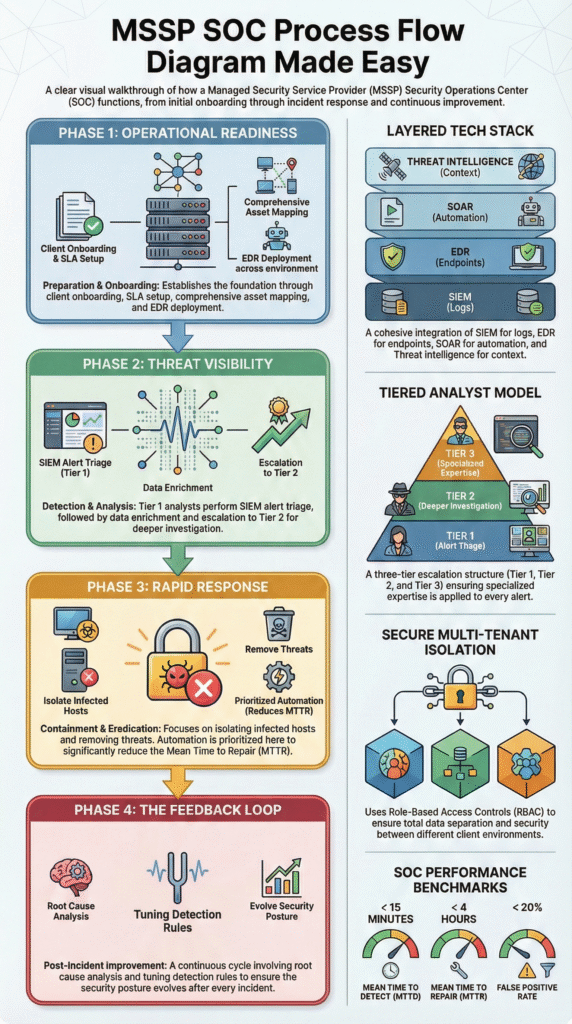
The standard flow breaks down into four repeating phases: Preparation, Detection & Analysis, Containment & Eradication, and Post-Incident Activity. This mirrors the NIST incident handling phases to keep operations consistent across all clients.
1. Preparation
This is all the work done before an incident happens. You can’t respond to what you can’t see.
It starts with understanding what you’re protecting. We help MSSPs map out asset discovery, validate that all critical log sources are feeding data correctly, and set up normalized log parsing. Establishing a “normal” baseline is crucial so you can spot deviations.
Key prep work includes:
- A solid client onboarding process.
- Defining SLAs with realistic targets, like a 15-minute MTTD.
- Getting EDR agents deployed everywhere.
- Mapping common threats to the MITRE ATT&CK framework for better detection.
We find that the effort put into preparation often decides whether an SOC will scale smoothly or drown when a real event storm hits.
2. Detection and Analysis
This phase kicks off when data hits the SIEM. It’s about separating the signal from the noise.
Tools with AI and machine learning help, but they’re guided by correlation rules built by humans. Analytics that track user behavior (UEBA) are great for flagging suspicious activity, like someone suddenly trying to access sensitive files.
A simplified flow looks like:
- Data comes in from a client’s environment.
- Correlation rules in the SIEM engine flag potential issues.
- A Tier 1 analyst triages the alert.
- The alert is enriched with threat intelligence data.
- If confirmed, it goes to Tier 2 for deeper investigation.
In today’s world, this happens across both cloud and traditional on-premise systems simultaneously. For a practical breakdown of how alerts move across tiers, this mirrors what teams see inside an MSSP SOC workflow.
3. Containment, Eradication, and Recovery
When an alert is confirmed as a real incident, the response machine activates.
Containment is about stopping the spread. This might mean isolating an infected laptop via EDR, disabling a hacked user account, or blocking a malicious IP. Eradication is removing the threat completely, deleting malware, closing backdoors. Recovery is restoring affected systems and making sure they’re clean.
Data, like from IBM’s Cost of a Data Breach Report, shows that teams using automation for containment can shorten a breach’s lifecycle by over 100 days on average. Automation has a direct, measurable impact on MTTR.
4. The Post-Incident Feedback Loop
This is the phase that most static diagrams forget, but it’s the most important for improvement.
After an incident, the team should:
- Conduct a root cause analysis to update diagrams and playbooks.
- Tune detection rules to reduce future false positives.
- Refine automated playbooks based on what worked (or didn’t).
- Feed these lessons into a continuous improvement cycle.
In our consulting, we push MSSPs to hold regular retrospectives. These sessions often uncover missed escalation triggers or unclear playbook steps. Those insights get fed directly back into the SOAR orchestration workflow. This loop turns a static diagram into a living, learning system.
Multi-Tenant SOC Architecture and Scaling Challenges
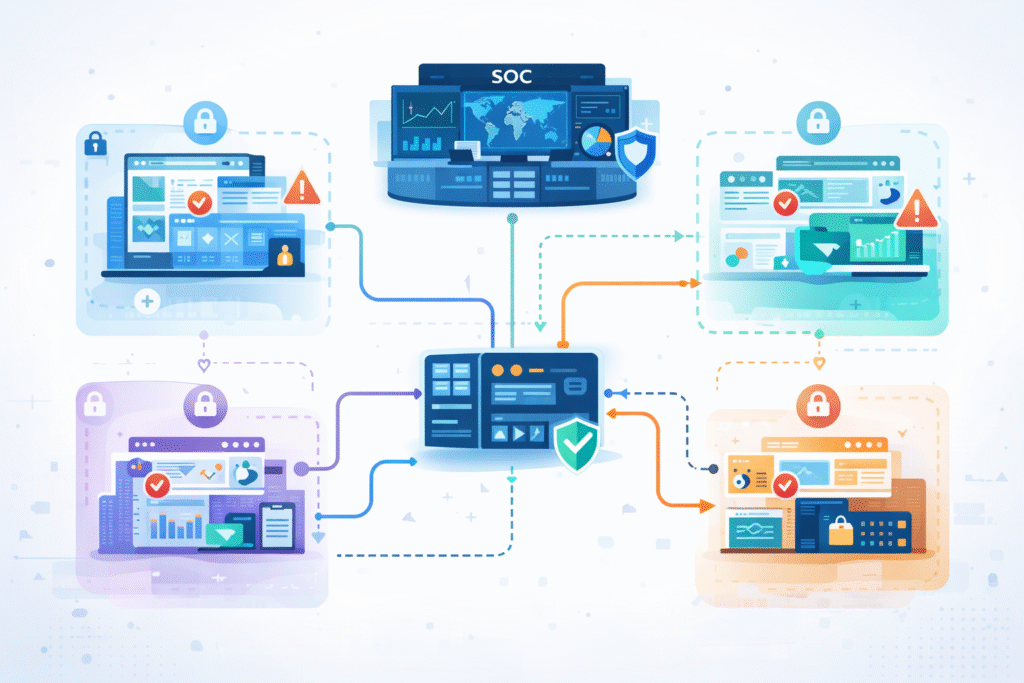
A multi-tenant SOC is built to serve many clients from one central operation. It shares tools and analysts but keeps each client’s data and cases completely separate through strict controls.
This architecture is what allows for growth. The multi-client isolation flow is enforced with role-based access controls, separate workspaces, and a unified case management system that walls off data. Yet scaling comes with real trade-offs. As noted by Blog,
“For most providers, tenant growth directly maps to operational sprawl… It’s the hidden tax of being a multi-tenant provider without a true multi-tenant architecture: replicated toil.” – Databahn
That insight explains why duplicated ingestion and normalization pipelines quietly erode margins. But scaling brings its own headaches.
- Alert fatigue becomes a major risk as the total volume of events grows.
- Escalation matrices must be crystal clear to avoid investigations getting stuck.
- Staffing ratios must be realistic and tied to the SLAs in the contracts.
To scale successfully, an MSSP needs:
- Smart filters to reduce noise.
- Alerting focused on deviations from established baselines.
- A move toward hyperautomation, using AI to handle repetitive tasks.
When done right, this hybrid approach lets an MSSP keep its promises to clients while also protecting its most valuable asset: its tired, human analysts.
Metrics That Define an Effective MSSP SOC Flow
A strong SOC flow shows up clearly in the numbers. In our consulting work with MSSPs, we look past dashboards and ask one simple question: does the workflow actually perform under pressure? Most clients still start with two core metrics because they are easy to understand and hard to fake:
- MTTD (Mean Time to Detect): How quickly a threat gets noticed
- MTTR (Mean Time to Respond): How fast the team contains and resolves it
These set the baseline, but they do not tell the full story. Health and efficiency show up when you track supporting KPIs alongside them.
| KPI | Why It Matters | A Good Target |
| MTTD | Speed of initial detection | Under 15 minutes |
| MTTR | Time to contain and resolve | Under 4 hours |
| False Positive Rate | Impacts analyst workload and burnout | Under 20% |
| Cost Per Incident | Reflects efficiency and ROI | Trending downward |
We often find the best results when metrics feed directly into operations. Teams that automate escalation triggers, use live threat intelligence, and close feedback loops consistently outperform peers. Numbers alone do nothing if they sit in reports. Metrics that shape tooling decisions and workflow tuning are the ones that build durable resilience.
Why Static Diagrams Fail and Living Workflows Win
A printed, static MSSP SOC diagram is outdated almost as soon as it’s framed. Cyber threats change faster than any document review cycle.
Too many diagrams look like simple, one-directional flowcharts. Real security operations are messier. They’re a web of interconnected loops, with constant pivots based on new information. Academic notes that,
“Multi-tenancy amplifies common SOC challenges throughout the situational awareness process… suggests practical improvements in tool integration, knowledge management, and workflow optimization.” – Diva Portal
Modern operational views integrate layers like:
- MITRE ATT&CK framework mapping to track attacker tactics.
- Insights from purple team exercises (where defense and offense teams work together).
- Lessons learned from red team simulations.
In our audits, the difference between a decorative Visio file and a true operational blueprint is constant iteration. The diagram must reflect the real-world shift handoff procedures, the actual forensic evidence collection steps, and the known friction points in escalation.
When we help an MSSP customize their playbooks, we treat their process diagram as a living document under constant revision, not a trophy on the wall.
FAQ
How does an MSSP SOC process flow diagram support multi-client environments?
An MSSP SOC process flow diagram shows how a provider manages multiple clients without mixing data or workflows. It outlines multi-tenant SOC architecture and multi-client isolation flow in a clear security operations center workflow.
This structure helps teams maintain separation, scale safely, and meet SLA compliance workflow expectations. It also supports hybrid SOC operations where shared tools handle different environments with consistent controls.
How do teams reduce alert fatigue in a security operations center workflow?
Teams reduce alert fatigue by improving the SIEM alert triage process and prioritizing meaningful alerts. They apply dynamic risk scoring, threat intelligence enrichment, and false positive tuning to filter noise.
A structured security operations center workflow also uses behavioral analytics flow and automation to rank alerts. Over time, these steps support alert fatigue reduction and improve MTTD MTTR optimization.
What role does automation play in a managed detection response pipeline?
Automation keeps a managed detection response pipeline fast and consistent. A SOAR orchestration workflow supports automated playbook execution for enrichment, routing, and containment.
This approach shortens containment eradication recovery time and clarifies escalation matrix diagram paths. As hyperautomation SOC trends grow, automation helps teams scale operations while maintaining accuracy and predictable response patterns.
How do frameworks guide incident response within MSSP diagrams?
Frameworks give structure to incident response decisions. Many diagrams follow NIST incident handling phases and align with MITRE ATT&CK framework integration.
This alignment supports cyber kill chain mapping and strengthens each incident response playbook. It also improves compliance audit trail quality and ensures analysts follow proven methods during investigations and response activities.
How can MSSPs continuously improve their SOC workflows?
Continuous improvement depends on built-in feedback loops. Teams run a post-mortem analysis loop using root cause analysis diagram reviews and AAR after action review sessions.
Data from a SOC metrics KPI dashboard highlights gaps and progress. Over time, continuous improvement PDCA cycles refine processes, improve staffing ratio optimization, and strengthen the overall MSSP SOC process flow diagram.
Why an MSSP SOC Process Flow Diagram Matters
In the end, a strong diagram turns strategy into action. It aligns people, tools, and outcomes into a repeatable cycle that improves over time. We encourage teams to look beyond visuals and focus on workflows that actually evolve and scale.
If you want guidance shaping or evaluating your SOC approach, work with MSSP Security experts. We help MSSPs simplify stacks, choose the right tools, and build processes that hold up in real operations.
References
- https://www.databahn.ai/blog/the-beacon-architecture-rethinking-multi-tenant-security-data-operations-for-mssps
- http://www.diva-portal.org/smash/get/diva2:1981730/FULLTEXT01.pdf