

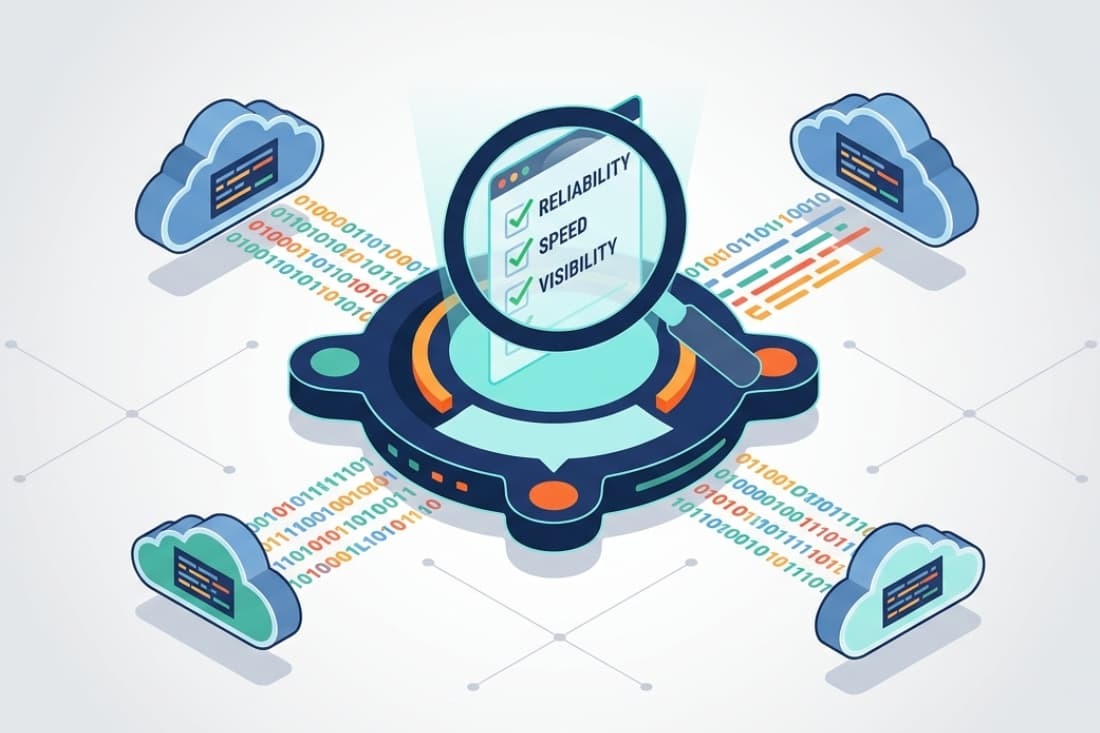
Cloud-native log collection services bring application, infrastructure, container, and Kubernetes logs into one place. Since Kubernetes doesn’t provide long-term log storage, production clusters need a separate system for collection and retention.
The right service should handle collection, filtering, storage, search, security, and retention without adding extra work. For MSSP security teams, strong access controls and reliable log search can also support monitoring and incident response.
Cost matters, too. Log volumes can grow fast across busy clusters, so filtering data early may help reduce storage costs. Keep reading to compare key features and pricing.
Cloud-Native Log Collection: What Matters Most
These key points summarize what to look for in a cloud-native log collection service, from centralized management to cost control and broader observability.
- Centralized collection keeps Kubernetes logs searchable across distributed workloads.
- Fluent Bit and OpenTelemetry Collector support flexible log collection and processing.
- Managed log collection reduces operational overhead for growing cloud environments.
- Filtering and retention help control logging costs and unnecessary data.
- Security and observability require logs to work alongside metrics, traces, and audit data.
What Makes Cloud Native Log Collection Different?
Cloud native workloads are short-lived, distributed, and constantly changing, but their logs still need to remain available for troubleshooting and security investigations.
Research from IEEE Computer Society shows
“This is further exacerbated by extensive cloud deployments, where observability is crucial for comprehending the health and performance of these systems, leading operations teams to collect as much data as possible for the ‘fear of missing out’. However, the collection, storage, and analysis of observability data entail significant costs, both in terms of resources and finances. Specifically, logs comprise the most substantial portion of observability data volume, thus exerting the greatest impact on observability cost.” – IEEE Computer Society
A traditional server may write application logs to the same location for months. A Kubernetes workload can restart, move to another node, scale up, or disappear within minutes.
Kubernetes commonly uses stdout and stderr for container logs. But that alone doesn’t give teams a complete logging setup.
Common sources include:
- Application logs from services and APIs.
- Container logs from short-lived workloads.
- Node logs from hosts and runtimes.
- Kubernetes events from cluster activity.
- Ingress logs from incoming traffic.
- Security logs for investigations.
Logs work best alongside metrics and traces because the three signals provide more context during troubleshooting.
Which Types of Cloud Native Log Collection Services Are Available?

The main choices are managed services, cloud-native platforms, and self-managed pipelines. Choose based on operational workload, required control, and portability.
Comparing different log collector options can also help teams decide whether they need a simple collection layer or a broader aggregation setup.
| Service approach | Best fit | Main consideration |
| Managed log collection | Teams wanting less operational overhead | Service scope and pricing |
| Cloud-native logging | Single-cloud environments | Portability can be limited |
| Open-source pipeline | Teams wanting more control | Needs internal expertise |
| Kubernetes-native collection | Kubernetes-heavy environments | More setup and maintenance |
| Hybrid architecture | Mixed cloud and on-prem systems | More integration work |
Regardless of the service type, teams need policies for collection, sensitive data, retention, and search. A typical pipeline includes:
- Collection: Capturing container, node, and event logs.
- Processing: Parsing, filtering, and adding useful data.
- Routing: Sending logs to the right destination.
- Storage: Keeping data for search or long-term use.
- Analytics: Supporting search, alerts, and investigations.
For multi-customer environments, also check whether the same collection policies and metadata can work across environments
How Does a Kubernetes Log Collection Pipeline Work?
A Kubernetes log pipeline moves records from the application to a searchable system. The main steps are collection, enrichment, processing, forwarding, storage, and search.
The basic flow has 7 stages:
- Generate: Apps create logs through stdout, stderr, or files.
- Collect: An agent reads those logs from each node.
- Enrich: Kubernetes details, such as pod, namespace, and node, are added.
- Process: Logs are parsed, filtered, changed, or redacted.
- Forward: Records are sent to the chosen destination.
- Store: The backend indexes and retains the logs.
- Query: Teams search logs, build dashboards, or create alerts.
Kubernetes commonly uses a node-level logging agent, often deployed as a DaemonSet, so each node has an agent.
Can the collector queue and retry records? Are dropped logs reported? These details matter because the pipeline itself is part of production infrastructure.
Which Collectors Should You Use for Kubernetes?
Fluent Bit fits a lightweight node-level collection, while OpenTelemetry Collector makes more sense when an organization wants one pipeline for logs, metrics, and traces.
For an MSSP, choosing a log collector agent should also account for resource use, customer isolation, deployment methods, and how easily the collector can be managed across multiple environments.
Evaluate the collection layer carefully because poor configuration can waste resources or cause data loss.
| Collector approach | Strong fit | Main consideration |
| Fluent Bit | Lightweight container logs | Pipeline configuration |
| OpenTelemetry Collector | Logs, metrics, and traces | More configuration |
| Fluentd-based collection | Existing Fluentd setups | Resource needs |
OpenTelemetry Collector uses receivers, processors, and exporters to control filtering, enrichment, batching, and routing.
When Is Fluent Bit or OpenTelemetry Collector the Better Choice?
Fluent Bit is a good fit when low resource use and node-level log forwarding are the main needs. It can run as a Kubernetes DaemonSet, so each node handles its own logs.
OpenTelemetry Collector fits teams building a wider observability setup. It can handle logs, metrics, and traces in the same pipeline. A collector that loses logs during a traffic spike isn’t doing its job.
Structured logs help too. Consistent fields make filtering, searching, routing, and correlation easier. JSON logs can also carry useful fields such as service names, severity, and trace IDs.
How Should You Choose a Cloud Native Log Storage Backend?

The right log storage backend depends on how teams search logs, how long they keep them, and what they can afford to run.
In our MSSP product reviews, we usually start with the query needs rather than the storage product. An engineer may search by service, namespace, request ID, or trace ID. A security team may need audit records across many workloads. Those needs can lead to very different storage choices.
| Storage approach | Strong fit | Main consideration |
| Label-oriented storage | Kubernetes log aggregation | Label design and cardinality |
| Full-text indexing | Broad log search | Higher indexing cost |
| Managed cloud storage | Lower operational work | Provider dependency |
| Object storage | Long-term archives | Query setup |
| Tiered storage | Mixed search and retention needs | Lifecycle management |
Why Does Indexing Strategy Matter?
Indexing affects both search speed and storage cost. Label-based systems can work well when teams know which fields they search most. Full-text indexing gives more freedom but can use more resources.
A better approach is to keep frequently searched logs in faster storage and move older records to lower-cost storage when needed. That gives teams useful search access without keeping every record in expensive storage forever.
How Can You Control Cloud Native Logging Costs?
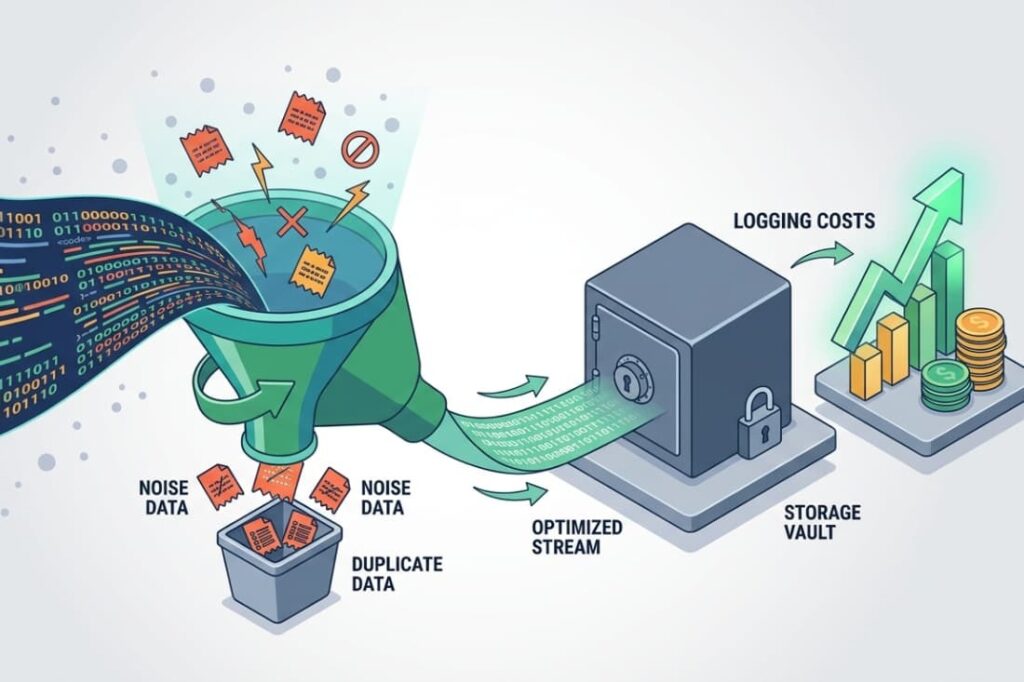
Cloud native logging costs come from ingestion, processing, indexing, storage, retention, and searches. We’ve seen costs rise fast when teams collect every record without first deciding what they need.
Data from arXiv demonstrates
“The results show that reducing log retention from 90 days to 14 days can lower log storage costs by up to 78 percent while preserving more than 97 percent of operationally useful logs. Longer retention windows provide diminishing operational returns while disproportionately increasing storage cost and query overhead.” – arXiv
The supplied research cites a Kubernetes visual handbook that places logging among the second or third largest infrastructure costs in some environments.
A good platform should help control log volume before data reaches costly storage.
- Filter noisy health checks when they add little value.
- Limit debug logs in production.
- Mask sensitive data before forwarding records.
- Use structured logs to reduce repeated parsing.
- Set retention based on actual needs.
- Move older logs to lower-cost storage.
- Watch for sudden changes in log volume.
A production API might keep error and access logs for 30 days, while less useful debug data may need less time. Security and compliance records can follow different rules.
Missing logs can make an investigation harder. So, the target isn’t the lowest possible log volume. It’s useful data at a cost the environment can support.
How Should Cloud Native Log Collection Handle Security and Compliance?
Cloud logs contain passwords, access tokens, and personal data. Therefore, collection pipelines must secure data at every step. NIST guidelines establish logs as core evidence for incident response.
Teams must enforce strict access controls on every data stream. Developers only need application error logs. Security engineers require full audit trails. Proper role-based access keeps sensitive customer data completely isolated.
Access should follow least-privilege rules. A developer may need application errors without access to security or audit logs. In shared environments, multi-tenancy, namespace isolation, role-based access, and audit trails help keep customer data separate.
Key controls include:
- Collection: Protect agents, credentials, and connections.
- Processing: Mask passwords, tokens, and personal data.
- Storage: Encrypt logs and limit admin access.
- Search: Control queries and dashboards by role.
- Retention: Follow legal and business requirements.
- Auditing: Track important access and admin actions.
This matters even more across customer environments. A logging service needs reliable collection, but it also needs clear boundaries around who can see, change, export, or retain each customer’s data.
How Should Multi-Cloud and Hybrid Log Collection Work?
Multi-cloud and hybrid logging is easier to manage when the same collection and processing setup works across different environments.
A company may run Kubernetes in public clouds, private data centers, and edge sites. The logs may look different, but security and operations teams still need one way to search and connect them.
OpenTelemetry supports this approach with a vendor-neutral pipeline. It can collect, process, and send telemetry to different systems. This can also make it easier to change storage systems later without rebuilding the entire logging setup.
Useful fields to standardize include:
- Environment
- Cluster
- Namespace
- Service
- Workload
- Pod
- Node
- Severity
- Trace ID
- Request ID
The goal isn’t to make every cloud identical. We want enough consistency for multi-cloud logging and hybrid cloud logging to stay manageable.
An engineer can move from an application error to its pod, node, and related infrastructure logs without translating fields between platforms. As more clusters are added, that consistency can save our teams a lot of cleanup work.
How Should You Evaluate and Deploy a Cloud Native Log Collection Service?
The best evaluation process uses real workloads, tests the pipeline under pressure, and measures the full cost of running it. A consistent log source onboarding process is also important when adding new applications, clusters, customers, or infrastructure to the logging environment.
A feature list can make most cloud native logging services look good. We prefer a controlled proof of concept because it shows what happens when the environment gets busy.
| Evaluation criterion | Questions to ask |
| Collection | Can it capture container, node, application, and event logs? |
| Kubernetes support | Can it discover pods and namespaces? |
| Scalability | Can it handle sudden log spikes? |
| Reliability | What happens when storage is unavailable? |
| Processing | Can teams filter and enrich logs? |
| Security | Can sensitive data be masked? |
| Search | Can engineers investigate quickly? |
| Retention | Can policies vary by log type? |
| Cost | What drives ingestion and storage costs? |
| Correlation | Can logs connect with metrics and traces? |
We test normal traffic, deployments, failures, node issues, traffic spikes, and destination outages. Collector CPU, memory, queue depth, latency, and dropped records also matter.
A service that looks fine during normal traffic but drops logs during a spike isn’t ready for critical workloads.
Which Deployment Pattern Fits Each Environment?
- Single cloud: Managed logging can reduce upkeep.
- Multi-cloud: Portable collectors improve consistency.
- Kubernetes-heavy: DaemonSets can collect node-local logs.
- Hybrid: Shared processing can normalize data.
- Cost-sensitive: Filtering and tiered retention matter early.
- Security-focused: Masking and access controls need early testing.
We often find that a mix of managed operations and portable collection gives MSSPs a useful balance.
What Should a Production Cloud Native Logging Architecture Monitor?

A production logging system needs its own monitoring. If the collection layer fails, teams may not notice until important logs are already missing.
During product reviews, we usually track log volume, processing time, queue depth, dropped records, collector CPU and memory, destination errors, and storage use.
These signals can help spot problems early. A sudden spike in log volume may point to heavy traffic, an application error, or a bad configuration. A sharp drop can be just as serious. It may mean a collector or workload has stopped sending logs.
Useful alerts include:
- High collector CPU or memory
- Growing queues
- Dropped or rejected logs
- Destination connection failures
- Unusual ingestion spikes
- Storage nearing capacity
- Sudden changes in error rates
- Missing logs from expected workloads
MSSP treats the logging pipeline like any other production service. It needs health checks, capacity planning, failure handling, access controls, and clear ownership.
That approach matters even more as a Kubernetes environment grows. A setup with a few workloads can be easy to watch. Hundreds or thousands of workloads can hide a failing collector unless the right signals are being tracked.
Which Cloud Native Log Collection Approach Should You Choose?
The right cloud native log collection setup should capture the logs teams need, keep them reliable, control costs, and make them easy to find during an incident.
For teams comparing cloud native logging services, we usually look at a few practical needs first:
| Priority | Recommended direction |
| Simplicity | Managed log collection |
| Lightweight collection | Fluent Bit-style architecture |
| Unified telemetry | OpenTelemetry-based collection |
| Portability | Vendor-neutral collection and processing |
| Kubernetes focus | DaemonSet-based collection |
| Cost control | Filtering, efficient indexing, tiered retention |
| Long-term archives | Lower-cost archival storage |
| Advanced investigation | Strong field and search capabilities |
| Security operations | Centralized security and audit logging |
| Multi-cloud | Consistent collection and metadata |
Application, infrastructure, container, Kubernetes, access, and security logs each serve a different purpose.
We also check how the pipeline handles log enrichment, parsing, filtering, routing, and transformation. Keeping these steps clear makes the system easier to manage and update later.
Our focus is simple: does the service reduce operational work while still meeting the team’s retention, security, search, cloud, and budget needs?
FAQ
What should a cloud native log collection service handle?
Cloud native log collection should bring application logs, infrastructure logs, container logs, and Kubernetes events into one central system. A good setup should support distributed log collection, reliable log forwarding, and centralised log aggregation.
It should also handle changing workloads without losing important records while keeping log storage, search, retention, security, access, and compliance requirements under control.
How should I choose a cloud native logging service?
Choose a cloud native logging service based on your log sources, data volume, search needs, and operating environment. Kubernetes log collection and container log collection may require different collection methods from serverless logs.
Check whether the service supports log processing, log filtering, log routing, retention, and scalable ingestion. It should also support your environment as workloads grow.
Which logs should I collect from Kubernetes environments?
A Kubernetes logging setup should collect logs from the application, container, node, and cluster levels.
Start with stdout log collection and container file logs, then add node logs, pod logs, Kubernetes events, audit logs, and security logs when they support a clear operational need. Use log parsing, enrichment, and transformation to make records easier to search and analyze.
Can one logging setup support multiple cloud environments?
Yes, one logging setup can support multiple cloud environments when collection and routing rules remain consistent. Multi-cloud logging and hybrid cloud logging often involve different infrastructure, permissions, and data formats.
A shared log pipeline can simplify centralized log aggregation, while structured logging and JSON logs can make log search and log analytics more consistent across different environments.
How can I control the cost of cloud log collection?
Control cloud log costs by collecting logs that support monitoring, troubleshooting, security, or compliance instead of sending every record to long-term storage.
Use log filtering and log routing to remove unnecessary data before ingestion. Set retention and archival periods based on actual needs, and review log volume, storage use, and search activity regularly to identify unnecessary spending.
Build A Log Pipeline That Can Scale
Cloud native logging works best when all parts of the system work together. Don’t collect every log by default. Focus on the logs your team needs for operations, security, compliance, and troubleshooting. This keeps the system easier to manage and can lower storage costs as your Kubernetes environment grows.
MSSP Security can help review your needs, improve your technology stack, and find tools that fit your goals. Talk to MSSP Security about your log strategy.
References
- https://ieeexplore.ieee.org/abstract/document/10643920
- https://arxiv.org/abs/2601.11584