
You need to monitor data movement channels because data never sits still. It flows through APIs, queues, pipelines, and networks constantly. If you don’t watch these pathways, you’re flying blind to leaks, performance crashes, and compliance failures. We’ve seen companies lose millions from undetected exfiltration through unmonitored SFTP servers.
Proper monitoring acts as an early warning system, catching anomalies before they become incidents. It’s not just about security, it’s about maintaining trust in your entire data ecosystem. Continue reading to build a monitoring strategy that protects your most valuable asset.
Key Takeaways
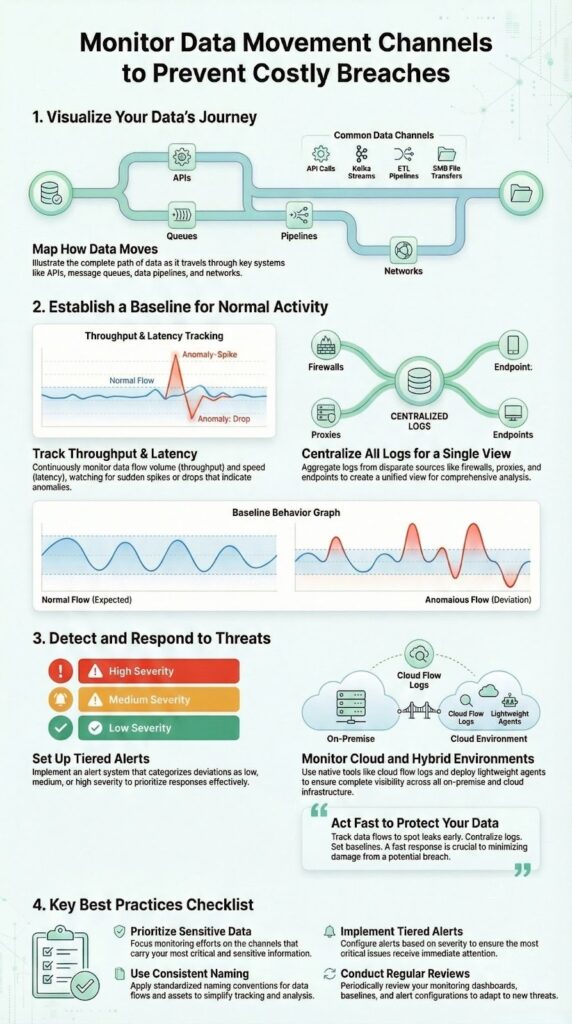
- Track throughput and latency across all channels to spot deviations.
- Centralize logs from firewalls, proxies, and endpoints for correlation.
- Set baselines for normal behavior to alert on true anomalies.
What Exactly Are You Monitoring?
Data movement channels are basically the roads your information uses to get from one place to another. You see them everywhere if you look closely enough:
- API calls handing customer details between microservices
- Kafka streams pushing real-time inventory updates
- ETL pipelines loading sales numbers into a data warehouse
- Network protocols like SMB moving files across shared drives
These channels sit inside almost every modern organization. They keep the business running, but they also open up weak spots. An unmonitored route is like a side door propped open with a brick. Monitoring these channels is part of effective MSSP security fundamentals and concepts to prevent costly breaches and maintain control over sensitive data flows.
Data can drift out without anyone noticing. Latency can creep in slowly until users feel it before you do. A pipeline can fail quietly, and nobody realizes until a dashboard shows blanks or a weekly report comes back with gaps.
We worked with a retailer that found out their pricing API had been leaking product cost data to a competitor. On the surface, the traffic looked normal. Regular API calls, nothing flashy. It only stood out when flow monitoring showed a strange pattern of requests going to an unknown external IP. No alarms, no big dramatic breach, just a slow, steady drip of sensitive numbers.
That’s the real risk with unmonitored channels:
- The threat doesn’t always look like an attack
- It can be subtle, repetitive behavior
- And by the time someone notices, the damage is already baked into decisions, reports, and lost advantage
Most of the danger isn’t loud. It’s quiet, regular, and easy to miss unless you’re watching the routes your data takes just as closely as the data itself.
The Technical Nuts and Bolts

You need multiple techniques because no single method catches everything. Packet inspection gives you the deepest view but can be resource-heavy. Flow monitoring provides a broader, aggregated picture. Log aggregation ties everything together with context.
Start with traffic analysis using tools that don’t overwhelm your team. Look at NetFlow data first. It tells you who’s talking to whom, how much they’re saying, and when. You’ll spot a server suddenly sending gigabytes to an external IP immediately. That’s often the first sign of exfiltration.
This approach aligns well with preventing sensitive data exfiltration by correlating network telemetry with endpoint logs.
Then layer in log aggregation. Centralize logs from your firewalls, proxies like NGINX, and endpoints. When your flow data shows an anomaly, the logs tell you which user account was involved or what application generated the traffic. This correlation is what turns a suspicious event into an actionable alert.
For specific channels, you need specialized approaches:
- API Traffic: Monitor rate limits, error rates, and response times. A spike in 5xx errors could indicate an attack or integration failure.
- File Transfers: Check SFTP logs for failed login attempts and unusual transfer volumes outside business hours.
- Message Queues: Track Kafka consumer lag. If lag increases, your real-time analytics are working with stale data.
The goal is visibility without paralysis. You want enough detail to investigate but not so much that your team ignores alerts.
Making Monitoring Work for Security

Security monitoring isn’t about stopping every single attack before it starts. That’s not realistic. It’s about seeing trouble fast and acting before it spreads.
You start by understanding what “normal” looks like for each data channel. That baseline is your reference point.
For example:
- If your database server usually sends around 2 GB per hour to a backup system, and that suddenly jumps to 20 GB, that spike needs attention.
- If a quiet internal API suddenly becomes the busiest path in your network, that’s worth a second look.
Without that sense of normal, every alert either feels urgent or gets ignored, and both paths are bad.
So you prioritize. Some channels are simply more dangerous during an attack.
- RDP and SMB are classic tools for lateral movement.
- Attackers use them to hop from one machine to another, or pull files they shouldn’t touch.
On those channels, you want to watch:
- Repeated or failed authentication attempts
- Unusual file access patterns or access outside normal hours
- Large file transfers or sudden directory scans
Then there’s DNS tunneling. It looks harmless on the surface, just DNS queries going out like usual. But attackers can hide data inside those requests, using a protocol that often gets a free pass because it’s rarely blocked [1].
Key checks there include:
- High volumes of odd-looking DNS queries
- Domains that don’t match normal user activity
- Long or weirdly structured subdomains
All of this becomes more powerful when you connect channel monitoring to your SIEM. That’s where patterns across systems start to tell a clear story.
You can set up rules like:
- If the firewall shows a blocked data exfiltration attempt
- And, at almost the same time, an endpoint log shows a user running a suspicious script
- Then raise a high-priority incident and alert the right team immediately
We worked with an MSP that tied their HTTP proxy logs into this kind of setup. They focused on command-and-control (C2) communications over HTTP. Now, when their system spots traffic to known malicious domains:
- It flags the endpoint
- Automatically isolates the device from the network
- And sends an alert with context for the analyst
What used to take hours of manual checking and back-and-forth now happens in minutes. The attacks didn’t magically stop, but the window of damage shrank, a lot.
That’s what practical monitoring looks like: not perfect defense, but faster, sharper reactions when the wrong kind of activity starts to move across your channels.
Building a Sustainable Practice
You can’t monitor everything the same way, and you shouldn’t try. The first step is deciding what truly matters to your business.
Think in terms of:
- How sensitive the data is
- How critical the service is to operations or customers
A real-time payment API carrying card data deserves more attention than an internal reporting job that runs once a week. Same with an identity service versus a test environment used by one small team.
From there, structure starts to matter more than tools. Applying MSSP security consulting principles helps organizations focus their efforts where risk is highest, optimizing resources and improving overall security posture.
Use consistent naming across all your monitoring systems. It sounds basic, but it’s one of the easiest ways to lose clarity.
Use consistent naming across all your monitoring systems. It sounds basic, but it’s one of the easiest ways to lose clarity.
For example:
- If one dashboard calls something service-inventory
- And your logs call it inventory-api
- And your alerting tool tags it as inv-svc
You’ve made correlation harder for no good reason. Standardizing these labels means:
- Faster incident triage
- Cleaner dashboards
- Fewer “what system is this actually about?” moments
Naming is boring until you need to connect three alerts at 2 a.m.
Then there’s alerting. The goal isn’t to scream every time a metric twitches. It’s to match the response to the impact.
You can frame it like this:
- A 10% increase in database replication lag?
- Maybe that creates a low-priority ticket for someone to review.
- A 500% increase in lag?
- That should page the on-call engineer and possibly trigger auto-scaling or failover logic.
This kind of tiered alerting helps avoid:
- Alert fatigue (where everything feels critical, so nothing really is)
- Silent failures (where you only find out when a user complains or a job fails)
To keep all this from going stale, you need a regular check-in with reality.
Review your monitoring strategy quarterly:
- Have any core services changed?
- Did new integrations add fresh data paths you aren’t watching yet?
- Are there channels that used to be critical but are now legacy or rarely used?
New data flows appear quietly—new vendor tools, new APIs, new sync jobs. If you don’t update your monitoring to match, coverage drifts out of date, even if the tools themselves are fine.
A sustainable practice doesn’t mean watching everything all the time. It means:
- Clear priorities
- Clean, consistent naming
- Alert rules that reflect real impact
- And a steady habit of coming back to ask, “Does this still match how our systems actually work now?”
Scaling Across Cloud and Hybrid Environments
Credits : Datadog
Once you move into cloud and hybrid setups, data doesn’t just stay in one place. It moves between regions, accounts, providers, and on-prem systems, and each hop is a chance to lose visibility if you’re not careful.
A good way to keep your footing is to build on what the cloud already gives you.
Use native visibility first:
- AWS VPC Flow Logs
- Azure NSG flow logs
- Similar tools in other providers
These sit at the virtual network layer and help you see:
- Which IPs are talking
- Which ports are used
- Whether traffic is accepted or dropped
They won’t tell you everything about the application behavior, but they draw the outline of the picture.
To fill in the middle, you move closer to the workload.
Add lightweight agents on cloud instances to watch:
- API calls between microservices
- Database connections and query patterns
- Outbound calls to third-party services
VPC or NSG logs might miss that detail, especially when traffic never leaves a private network or uses internal service discovery. Agents help you understand what is being called, not just where packets are going [2].
Hybrid setups raise the stakes even more. Now you’ve got on-prem, one or more clouds, maybe multiple regions, all acting like different neighborhoods in the same city.
In that kind of environment, you need:
- A centralized logical view, even if the collection is physically distributed
- Local collectors or forwarders on-prem and in each cloud
- A central analysis layer (often your SIEM or a monitoring platform)
The usual pattern is:
- Collect data locally (to reduce latency and avoid overloading links)
- Normalize and enrich it as close to the source as possible
- Ship it to a central point for correlation, alerting, and investigation
One detail that quietly breaks a lot of hybrid monitoring? Time.
You need tight time synchronization across:
- On-prem servers
- Cloud instances
- Managed services that emit logs in different formats
Without aligned clocks, correlation turns into guesswork. “Did this firewall event really line up with that API error?” becomes a shrug instead of a match.
At scale, manual thresholds don’t hold up well, especially in cloud where traffic patterns shift with autoscaling, new deployments, and changing workloads.
That’s where automated anomaly detection starts to earn its keep:
- Machine learning models can learn “normal” for each channel
- They adapt when patterns legitimately change
- They flag outliers without you constantly tuning thresholds by hand
This is especially useful when:
- A microservice scales from 3 instances to 30 during peak hours
- Regional traffic shifts due to load balancing
- New internal consumers start calling an API more aggressively
Instead of chasing moving targets, you let the system update its understanding of baseline behavior, then focus your attention on real deviations.
Putting it all together for cloud and hybrid monitoring usually looks like this:
- Native cloud flow logs for broad network visibility
- Agents for application-level insight and context
- Distributed collection with centralized analysis
- Strict time sync across every source
- ML-backed anomaly detection to keep pace with constant change
The challenge isn’t just seeing the traffic. It’s keeping one coherent story across clouds, data centers, and services that don’t care where your boundaries used to be.
FAQ
How does data flow monitoring help control data movement channels?
Data flow monitoring tracks how data moves across systems. It uses network traffic analysis, flow monitoring, and NetFlow analysis. Teams watch ingress egress traffic, bandwidth utilization, throughput metrics, and latency tracking. This view spots risks early, supports data leakage prevention, and improves cloud data movement control across hybrid cloud monitoring setups for endpoint data flows visibility and zero-trust network access.
What methods detect hidden threats in network traffic?
Network traffic analysis finds threats like data exfiltration detection and ransomware lateral movement. Analysts use packet inspection tools, protocol decoding, and source destination mapping. DNS tunneling alerts, C2 communication detection, and port scanning alerts raise flags. Real-time alerting with baseline traffic profiling helps incident response forensics act fast via SIEM integration and log aggregation from firewall telemetry and proxy logs.
Why track API, file, and endpoint data movements?
Teams monitor APIs and files to protect daily work. API traffic oversight, file transfer logging, SFTP surveillance, and HTTP proxy logs show use. Database query monitoring, SMB file shares, and RDP session tracking expose misuse. This control supports DLP enforcement and unauthorized access logs across endpoint data flows using proxy server logs and NGINX access logs for audits today now.
How do teams monitor data pipelines and streaming systems?
Modern pipelines need visibility from start to finish. ETL pipeline visibility, Kafka stream analysis, and message queue monitoring track flow. Spark job monitoring, Apache Flink metrics, and Airflow DAG monitoring reveal health. Data quality metrics, freshness checks, and job failure alerts keep pipelines stable. Teams add dbt pipeline testing and resource utilization tracking with CPU memory spikes disk I/O patterns.
What tools watch cloud, container, and user behavior traffic?
Cloud and container traffic needs close watch. AWS VPC Flow Logs, Azure NSG flows, and Kubernetes service mesh show paths. Istio traffic management, Envoy proxy metrics, and gRPC monitoring add detail. UEBA behavioral analysis and ML anomaly models support threat hunting queries. They scale to petabyte data lakes using streaming analytics tools with Splunk data pipelines and ELK Stack logging.
Your Monitoring Foundation
Monitoring data movement channels transforms your security posture from reactive to proactive. It turns unknown risks into managed ones. The goal isn’t perfection. It’s awareness. Knowing what’s moving where, when, and how much.
Start with your most critical data and work outward. Map the channels that carry it. Implement basic flow monitoring and log aggregation. Then refine your approach based on what you discover. Every organization’s data flow is unique. Your monitoring should reflect that uniqueness.
The alternative is waiting for a breach to tell you where your weaknesses are. That’s a costly way to learn. Better to build your visibility now, channel by channel. Your future self will thank you when you catch an issue early, before it becomes a headline.
Ready to secure your data flows? Assess your current channel visibility and identify one high-risk pathway to monitor this week. Join our expert MSSP consulting to streamline operations, reduce tool sprawl, and boost service quality. Start here: MSSP Security!
References
- https://en.wikipedia.org/wiki/Collection_No._1
- https://www.51sec.org/2021/02/16/security-events-and-data-breaches-in-2018-2017-2016-2015-2014/